


The data visualization created was to investigate the significant
differences and to demonstrate whether the measures are any
indication to produce techniques by recognizing a transitional
segment. e In the data visualization, the techniques provided included
the understanding of the descriptive statistics (summary) performed
in R programming language. e This technique is conducted to assess
the construct validity of each input data respectively to the factor
analysis revealing a transitional phase segment and any significant
correlation between the various obtained functions. Furthermore,
the descriptive statistics function in R programming language
provides an internal consistency of reliability to determine an
acceptable measure related to the scores of a single factor. Below
are three descriptive statistics functions performed using R
programming language to investigate this methodology for further
implication to define a visualization technique (see tables below).
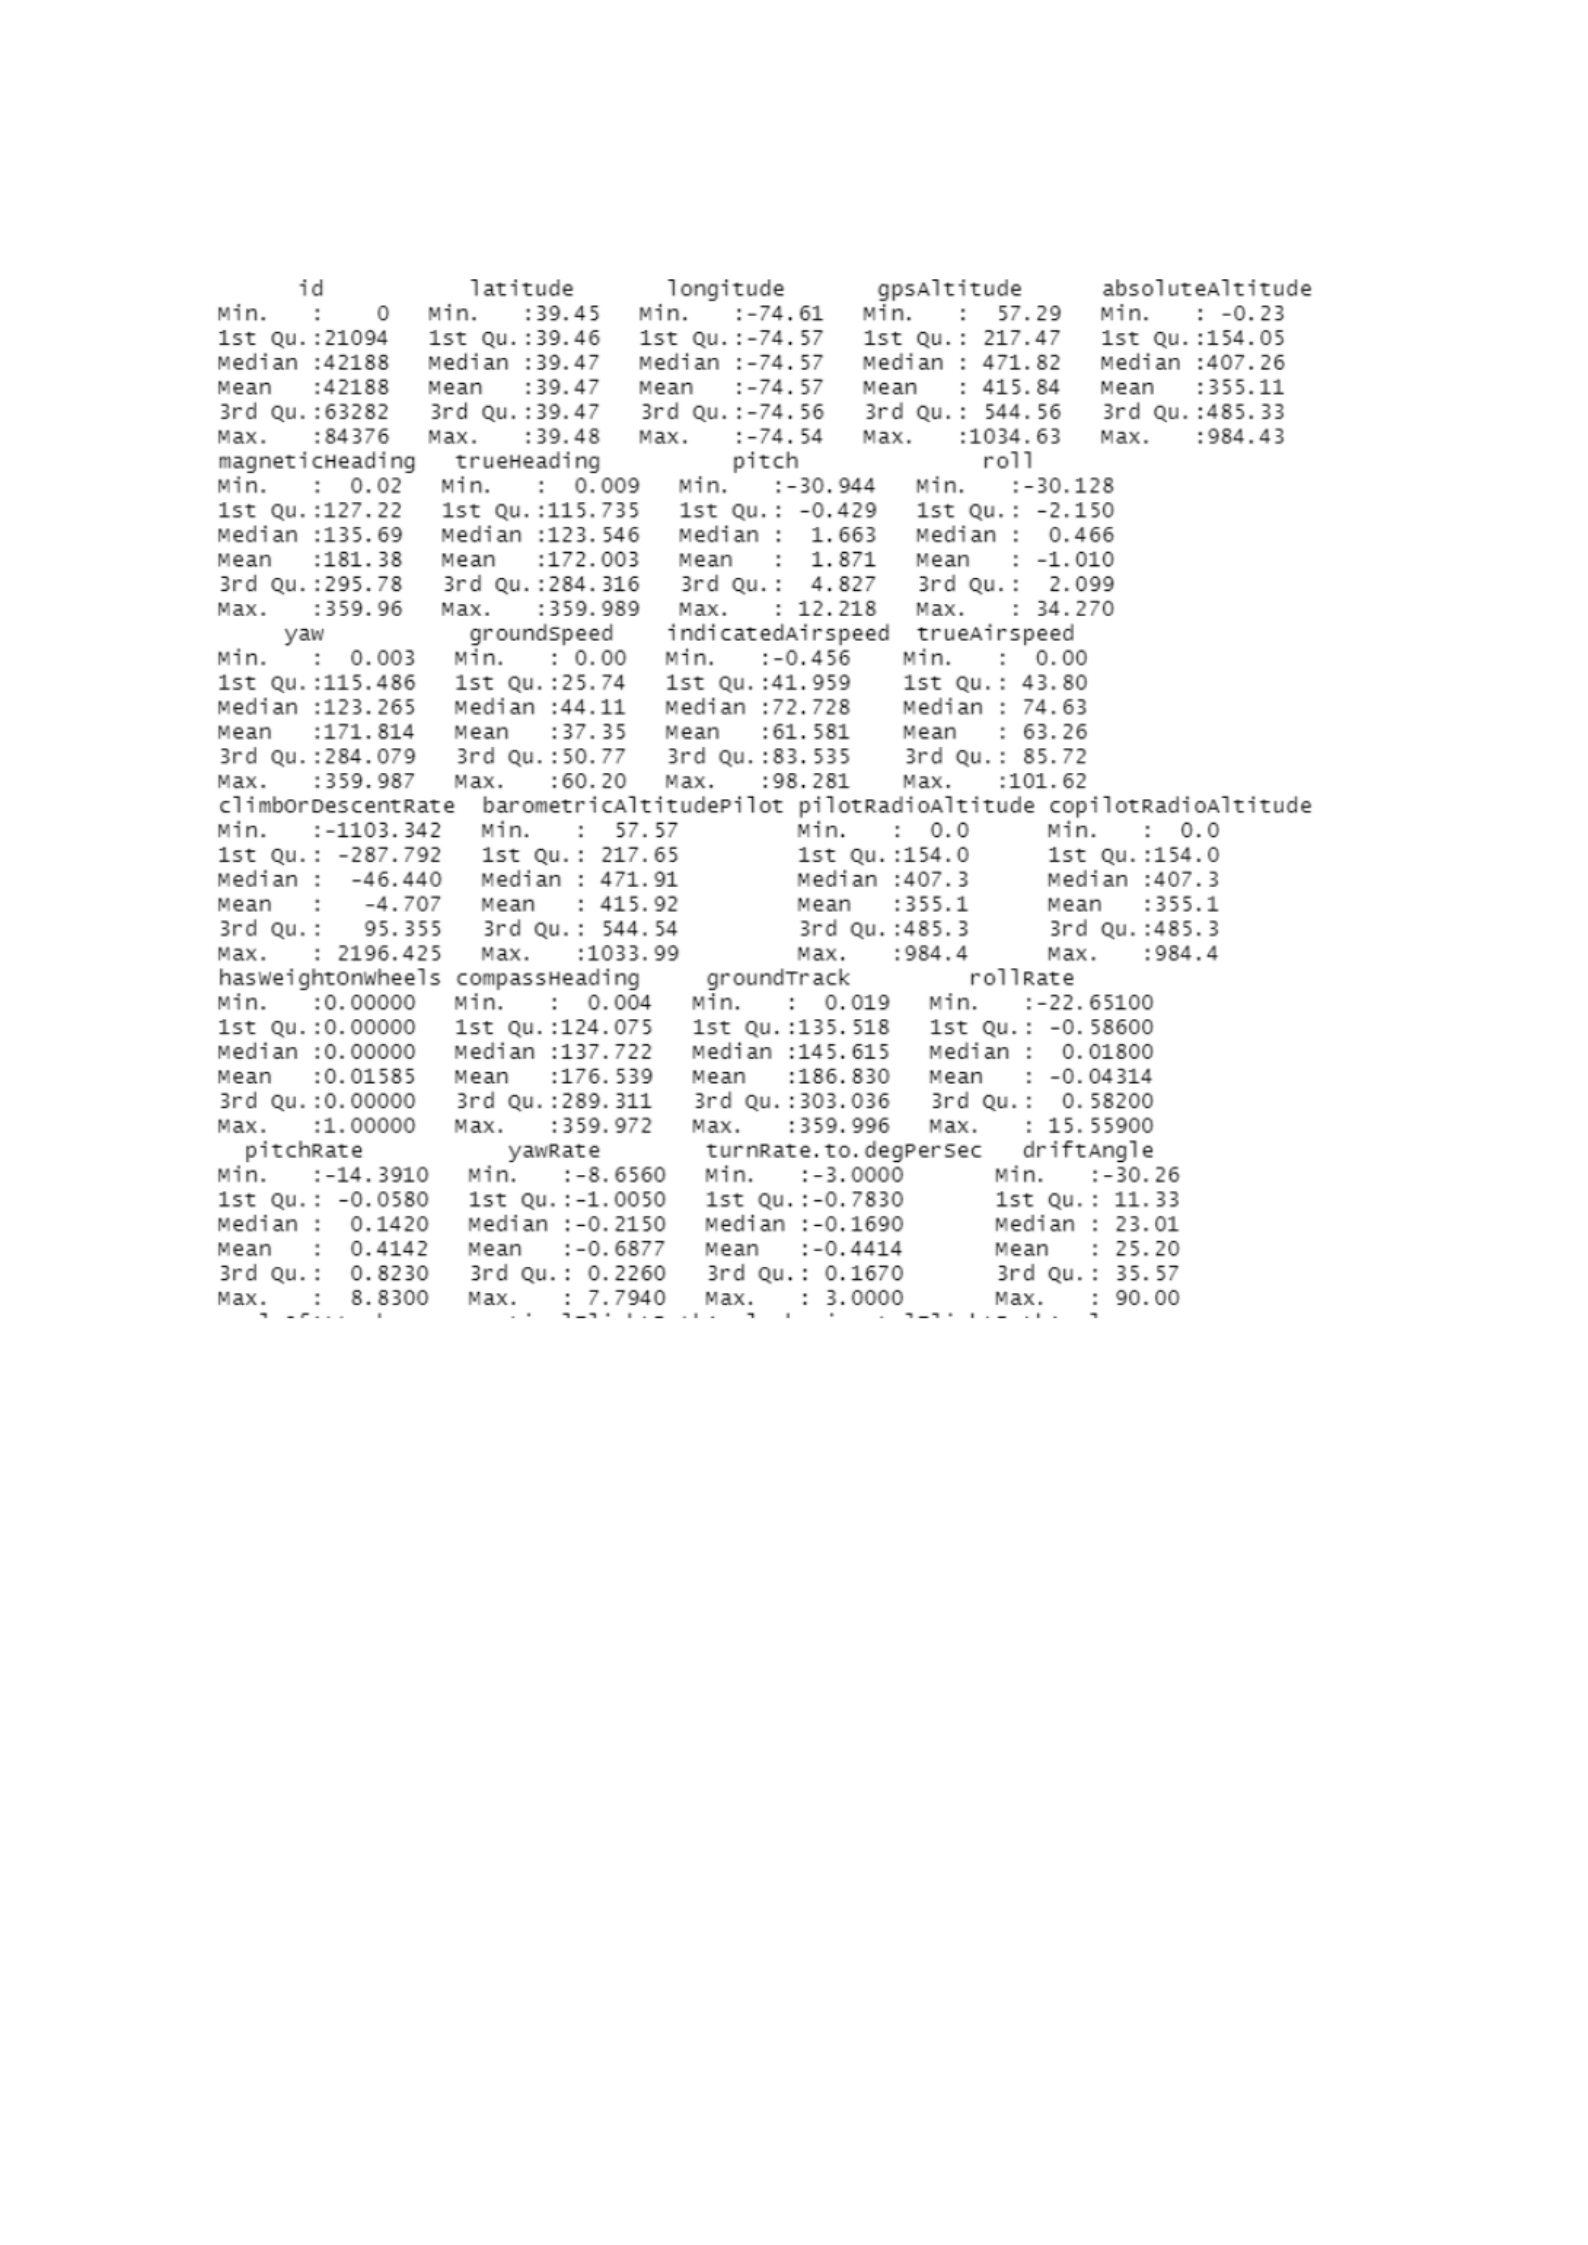
Table
. (Part 1 out of 3 tables presented). Descriptive statistics using
R programming language to perform functions of each input data
regarding minimum, the 1st quantile, the median, the mean, the 3rd
quantile, and the maximum values.
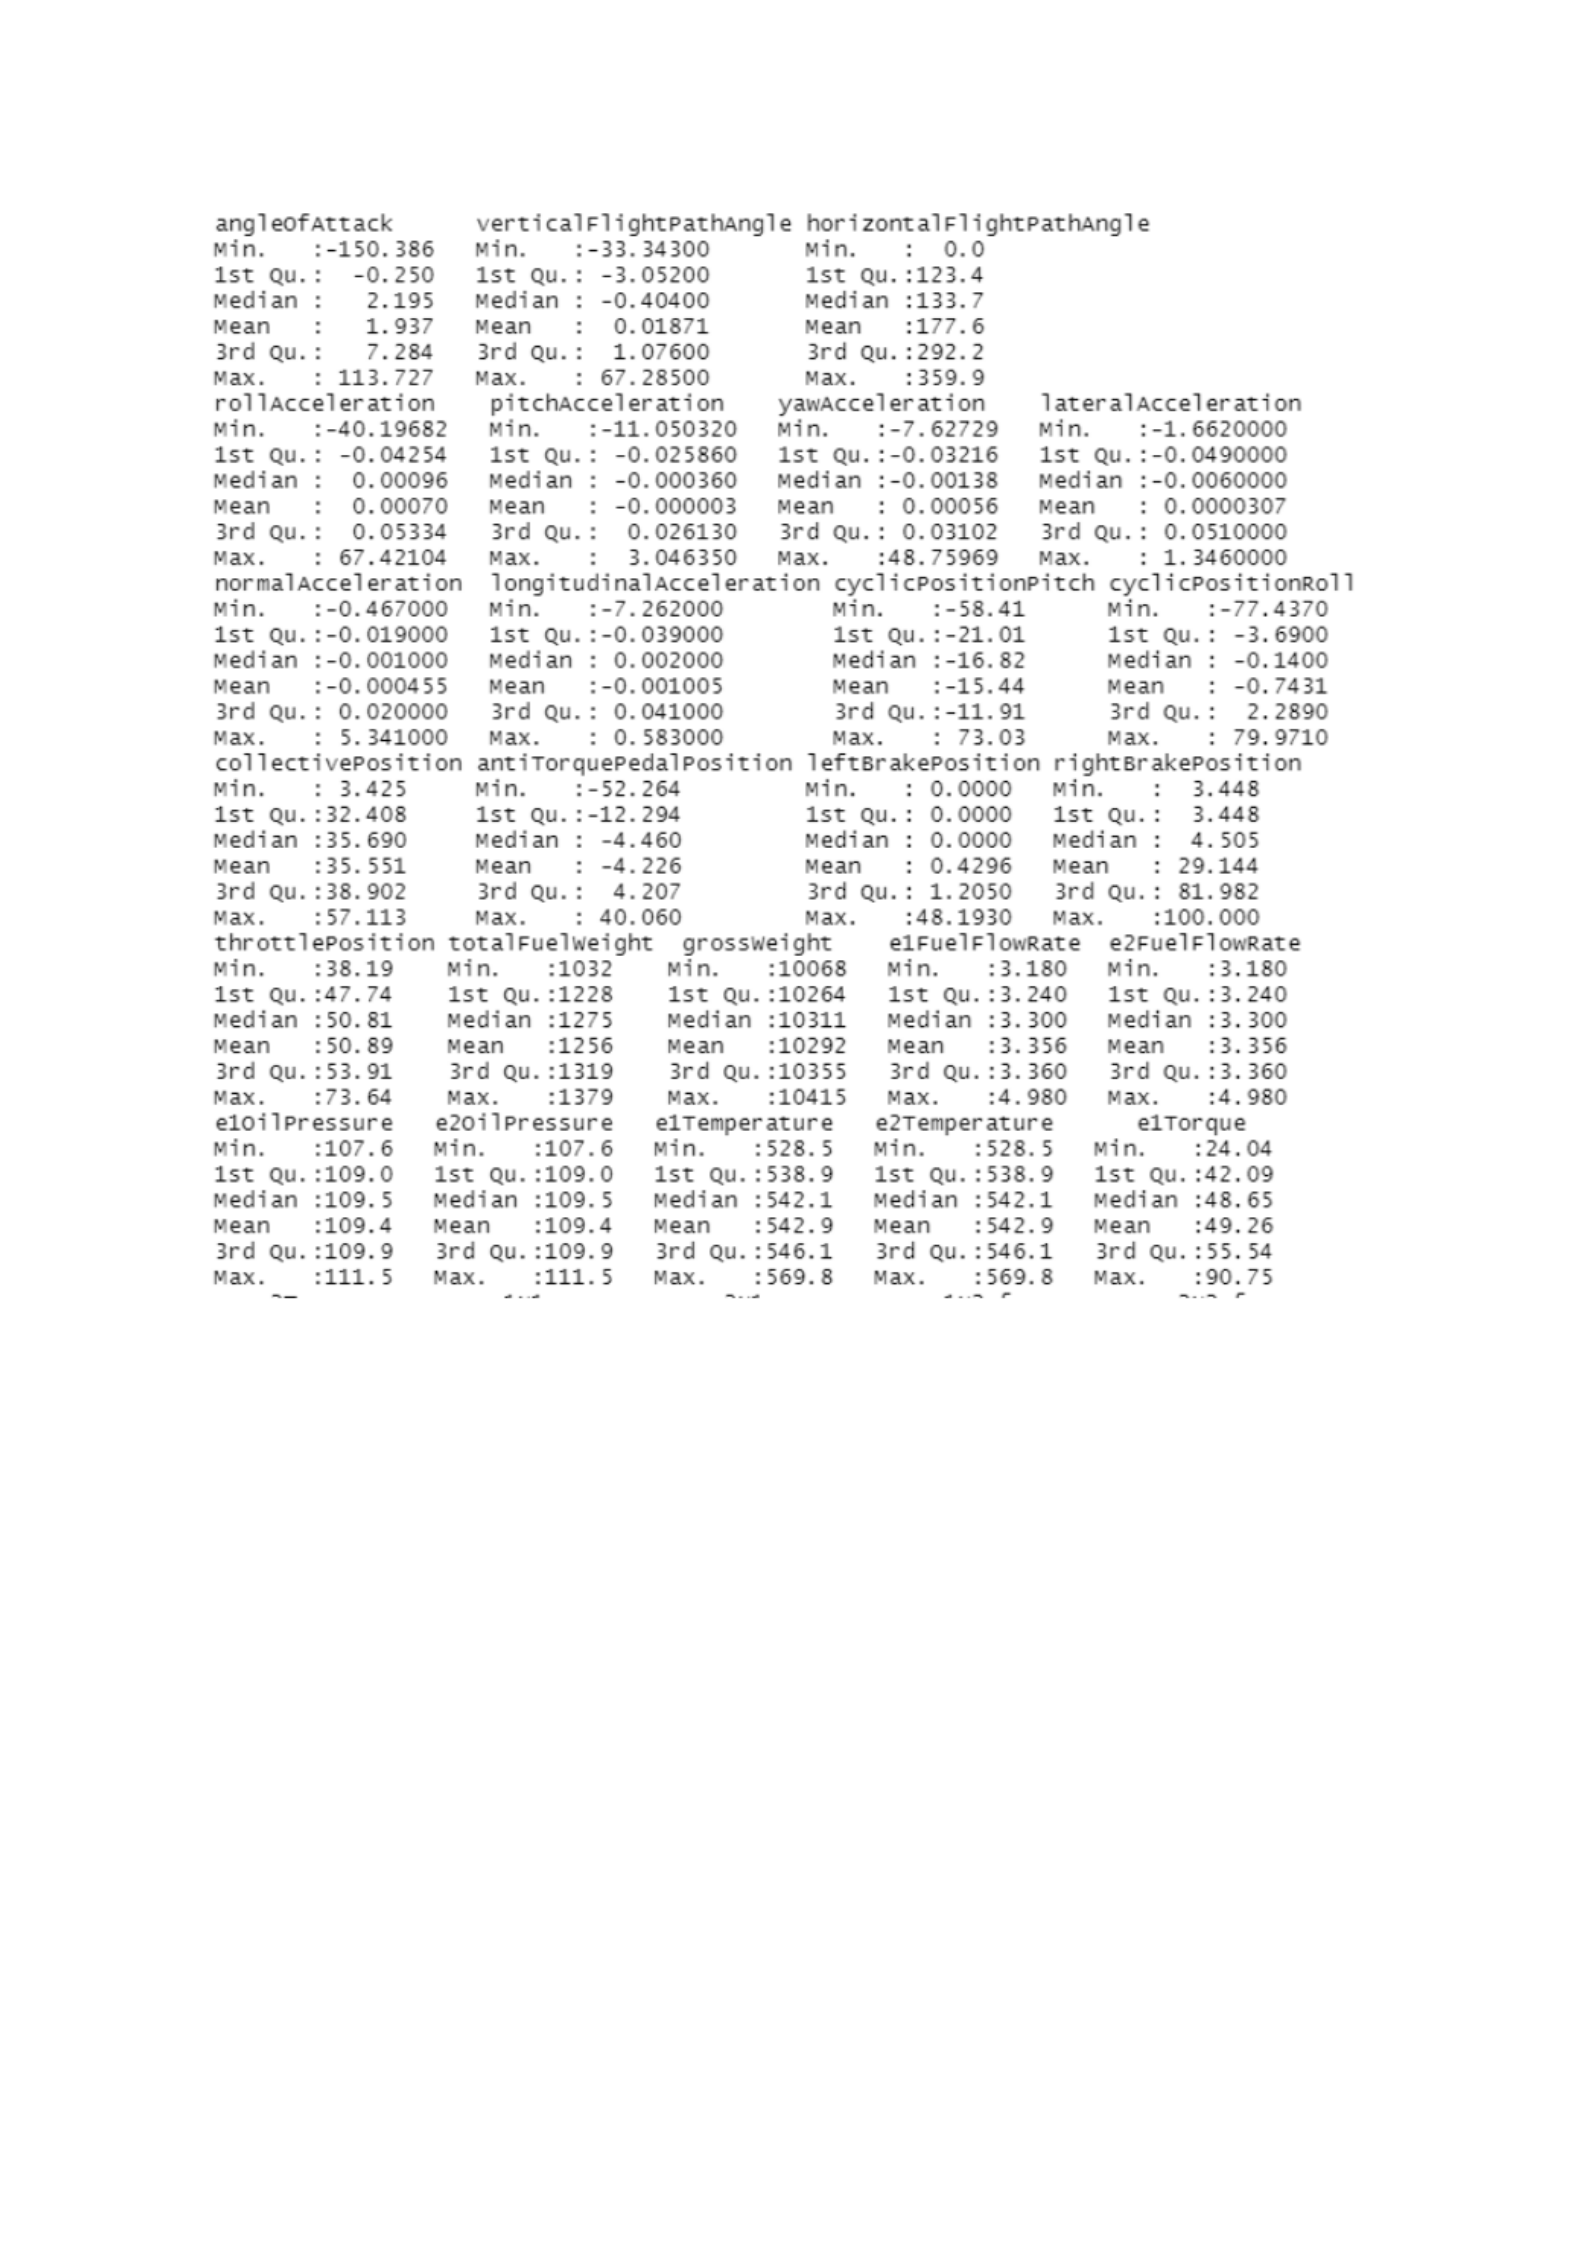
Table
. (Part 2 out of 3 tables presented). Descriptive statistics using
R programming language to perform functions of each input data
regarding minimum, the 1st quantile, the median, the mean, the 3rd
quantile, and the maximum values.
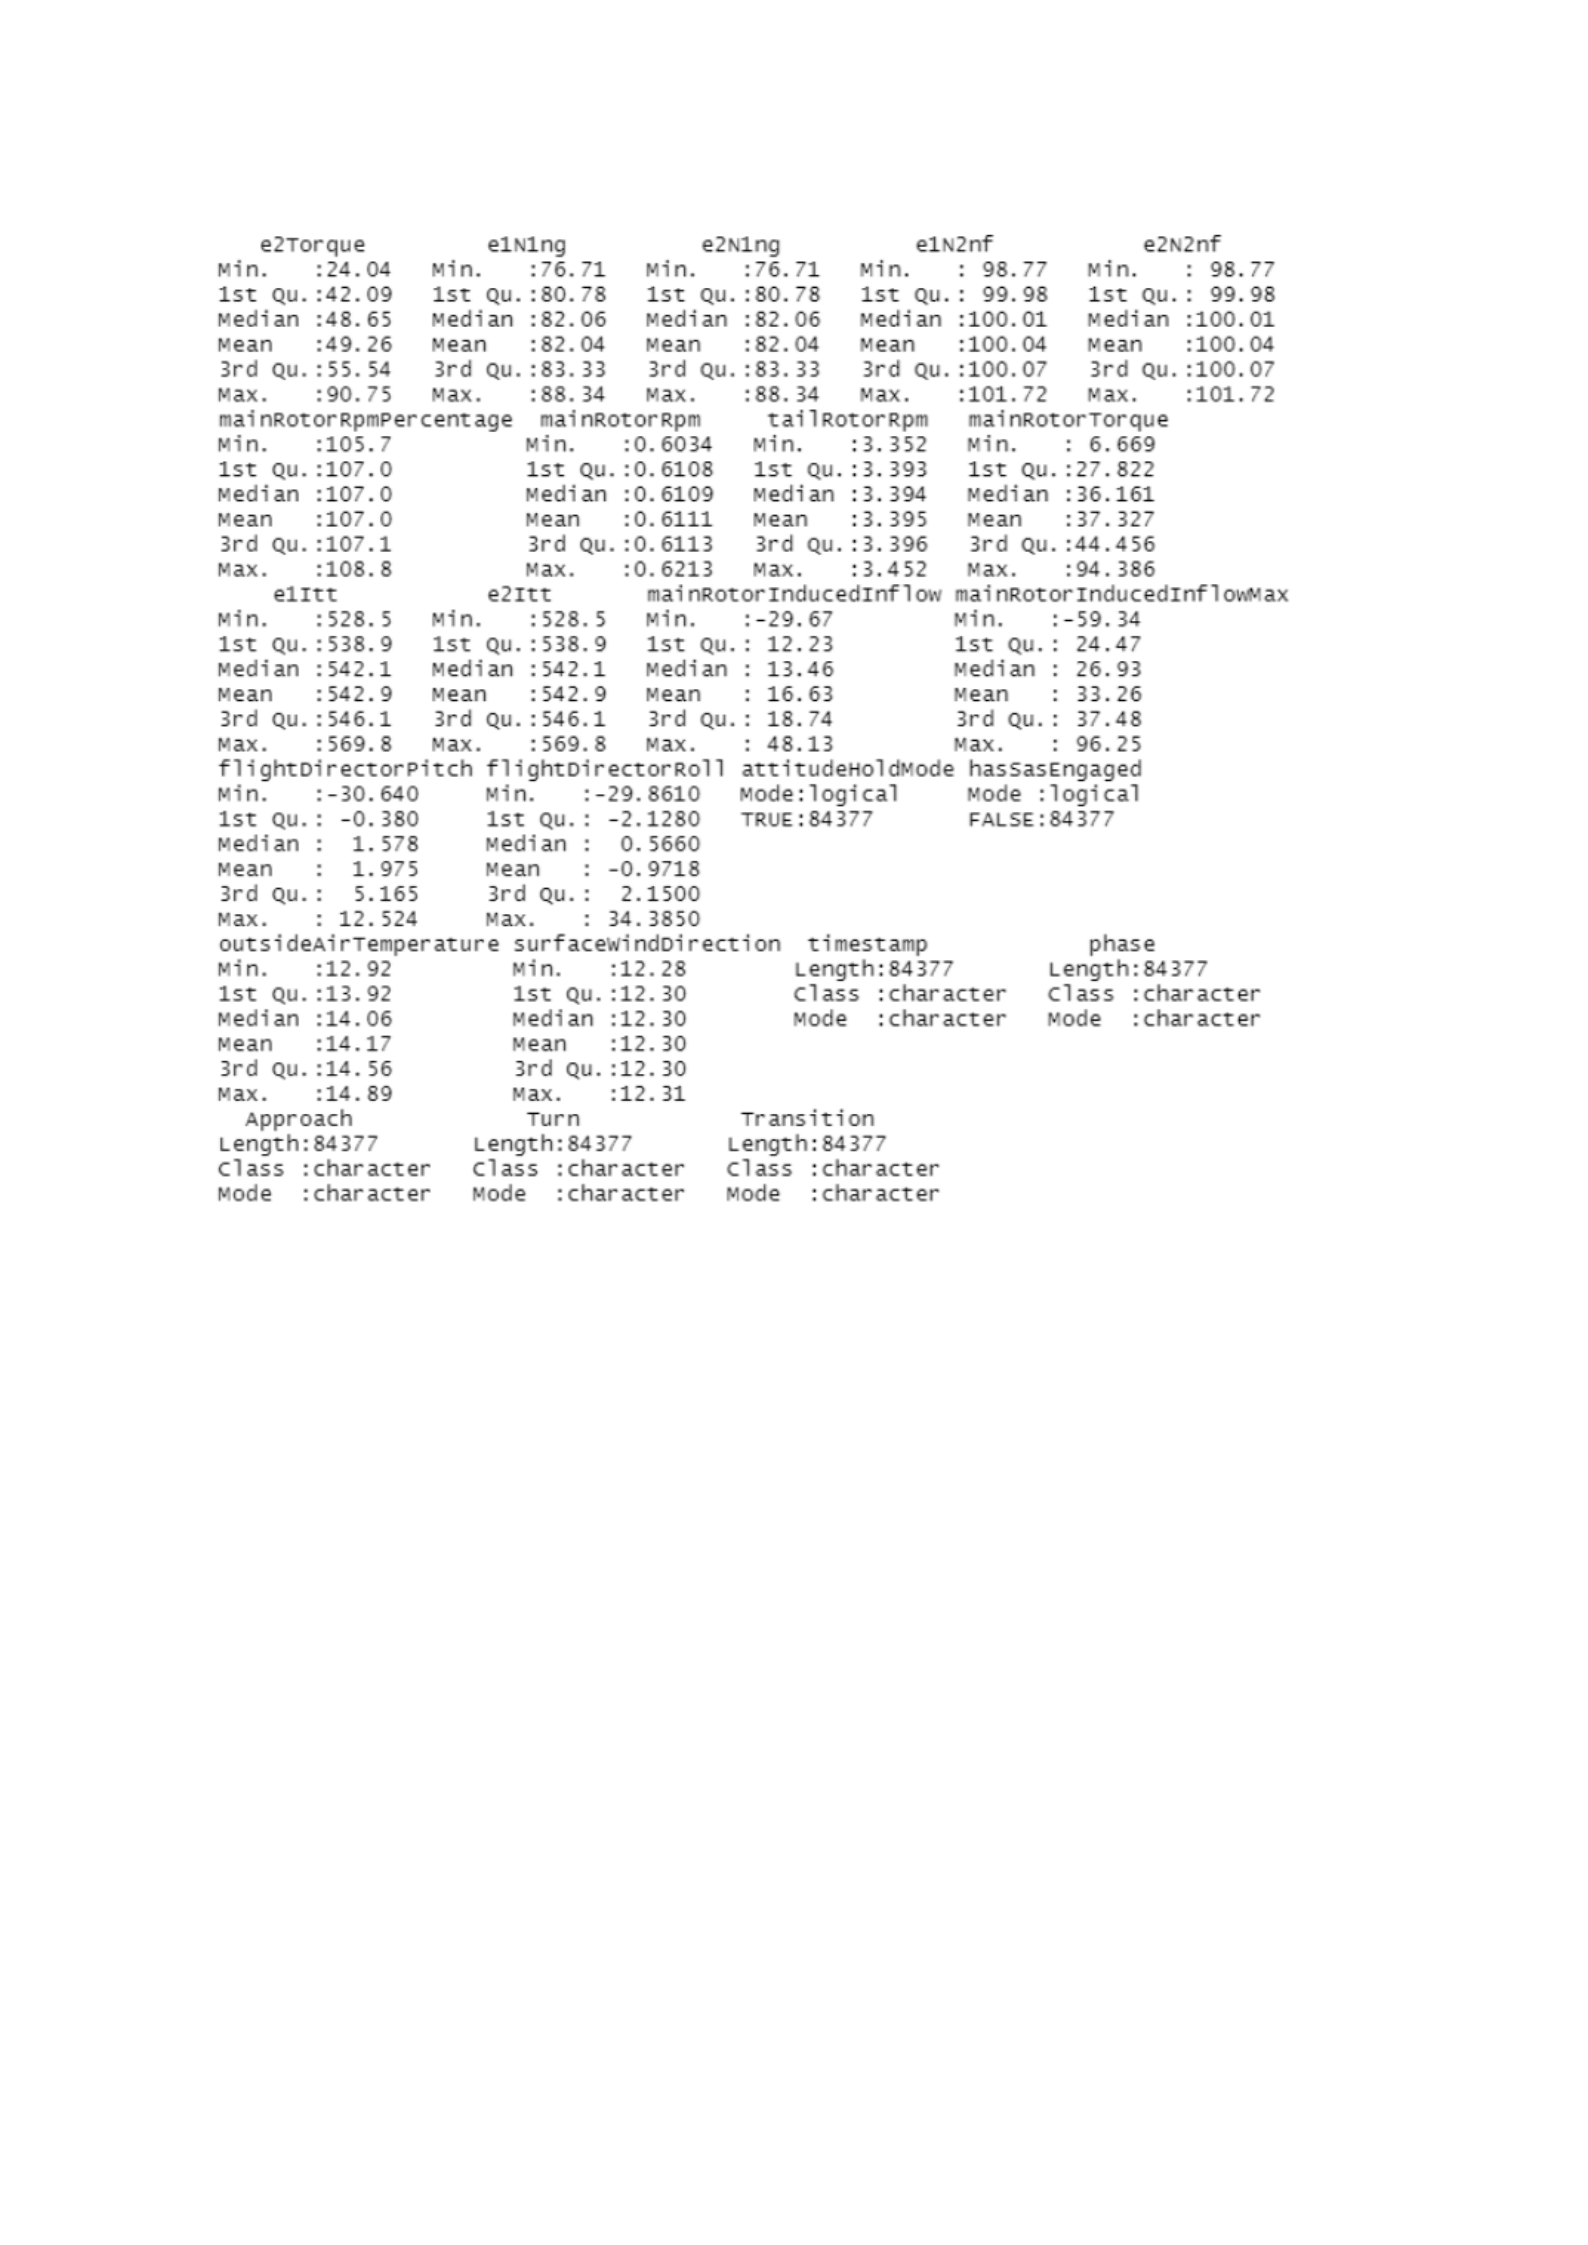
Table
. (Part 3 out of 3 tables presented). Descriptive statistics using
R programming language to perform functions of each input data
regarding minimum, the 1st quantile, the median, the mean, the 3rd
quantile, and the maximum values.
From the investigation of the descriptive statistics, this study offers
the ability to exercise the
StatExplore
feature in SAS Enterprise
Miner. The described visualization includes the ability to examine
the class variation of the target factor and the associated variable
for a defined training output. e To examine against the datasets, the
function to provides additional insight of the results showing
reasonable trade-offs between performance and accuracy of the
factors. e For example, the class variation can be inherited to show
that timely training is achievable due to the dimensions of results. e
This approach was explored to understand the training data of the
class variable summary statistics e from the data role (train). e The
data role (train) can be described using the variable name, role,
number of levels, missing, modes, and modes percentage (see
figures below).
e
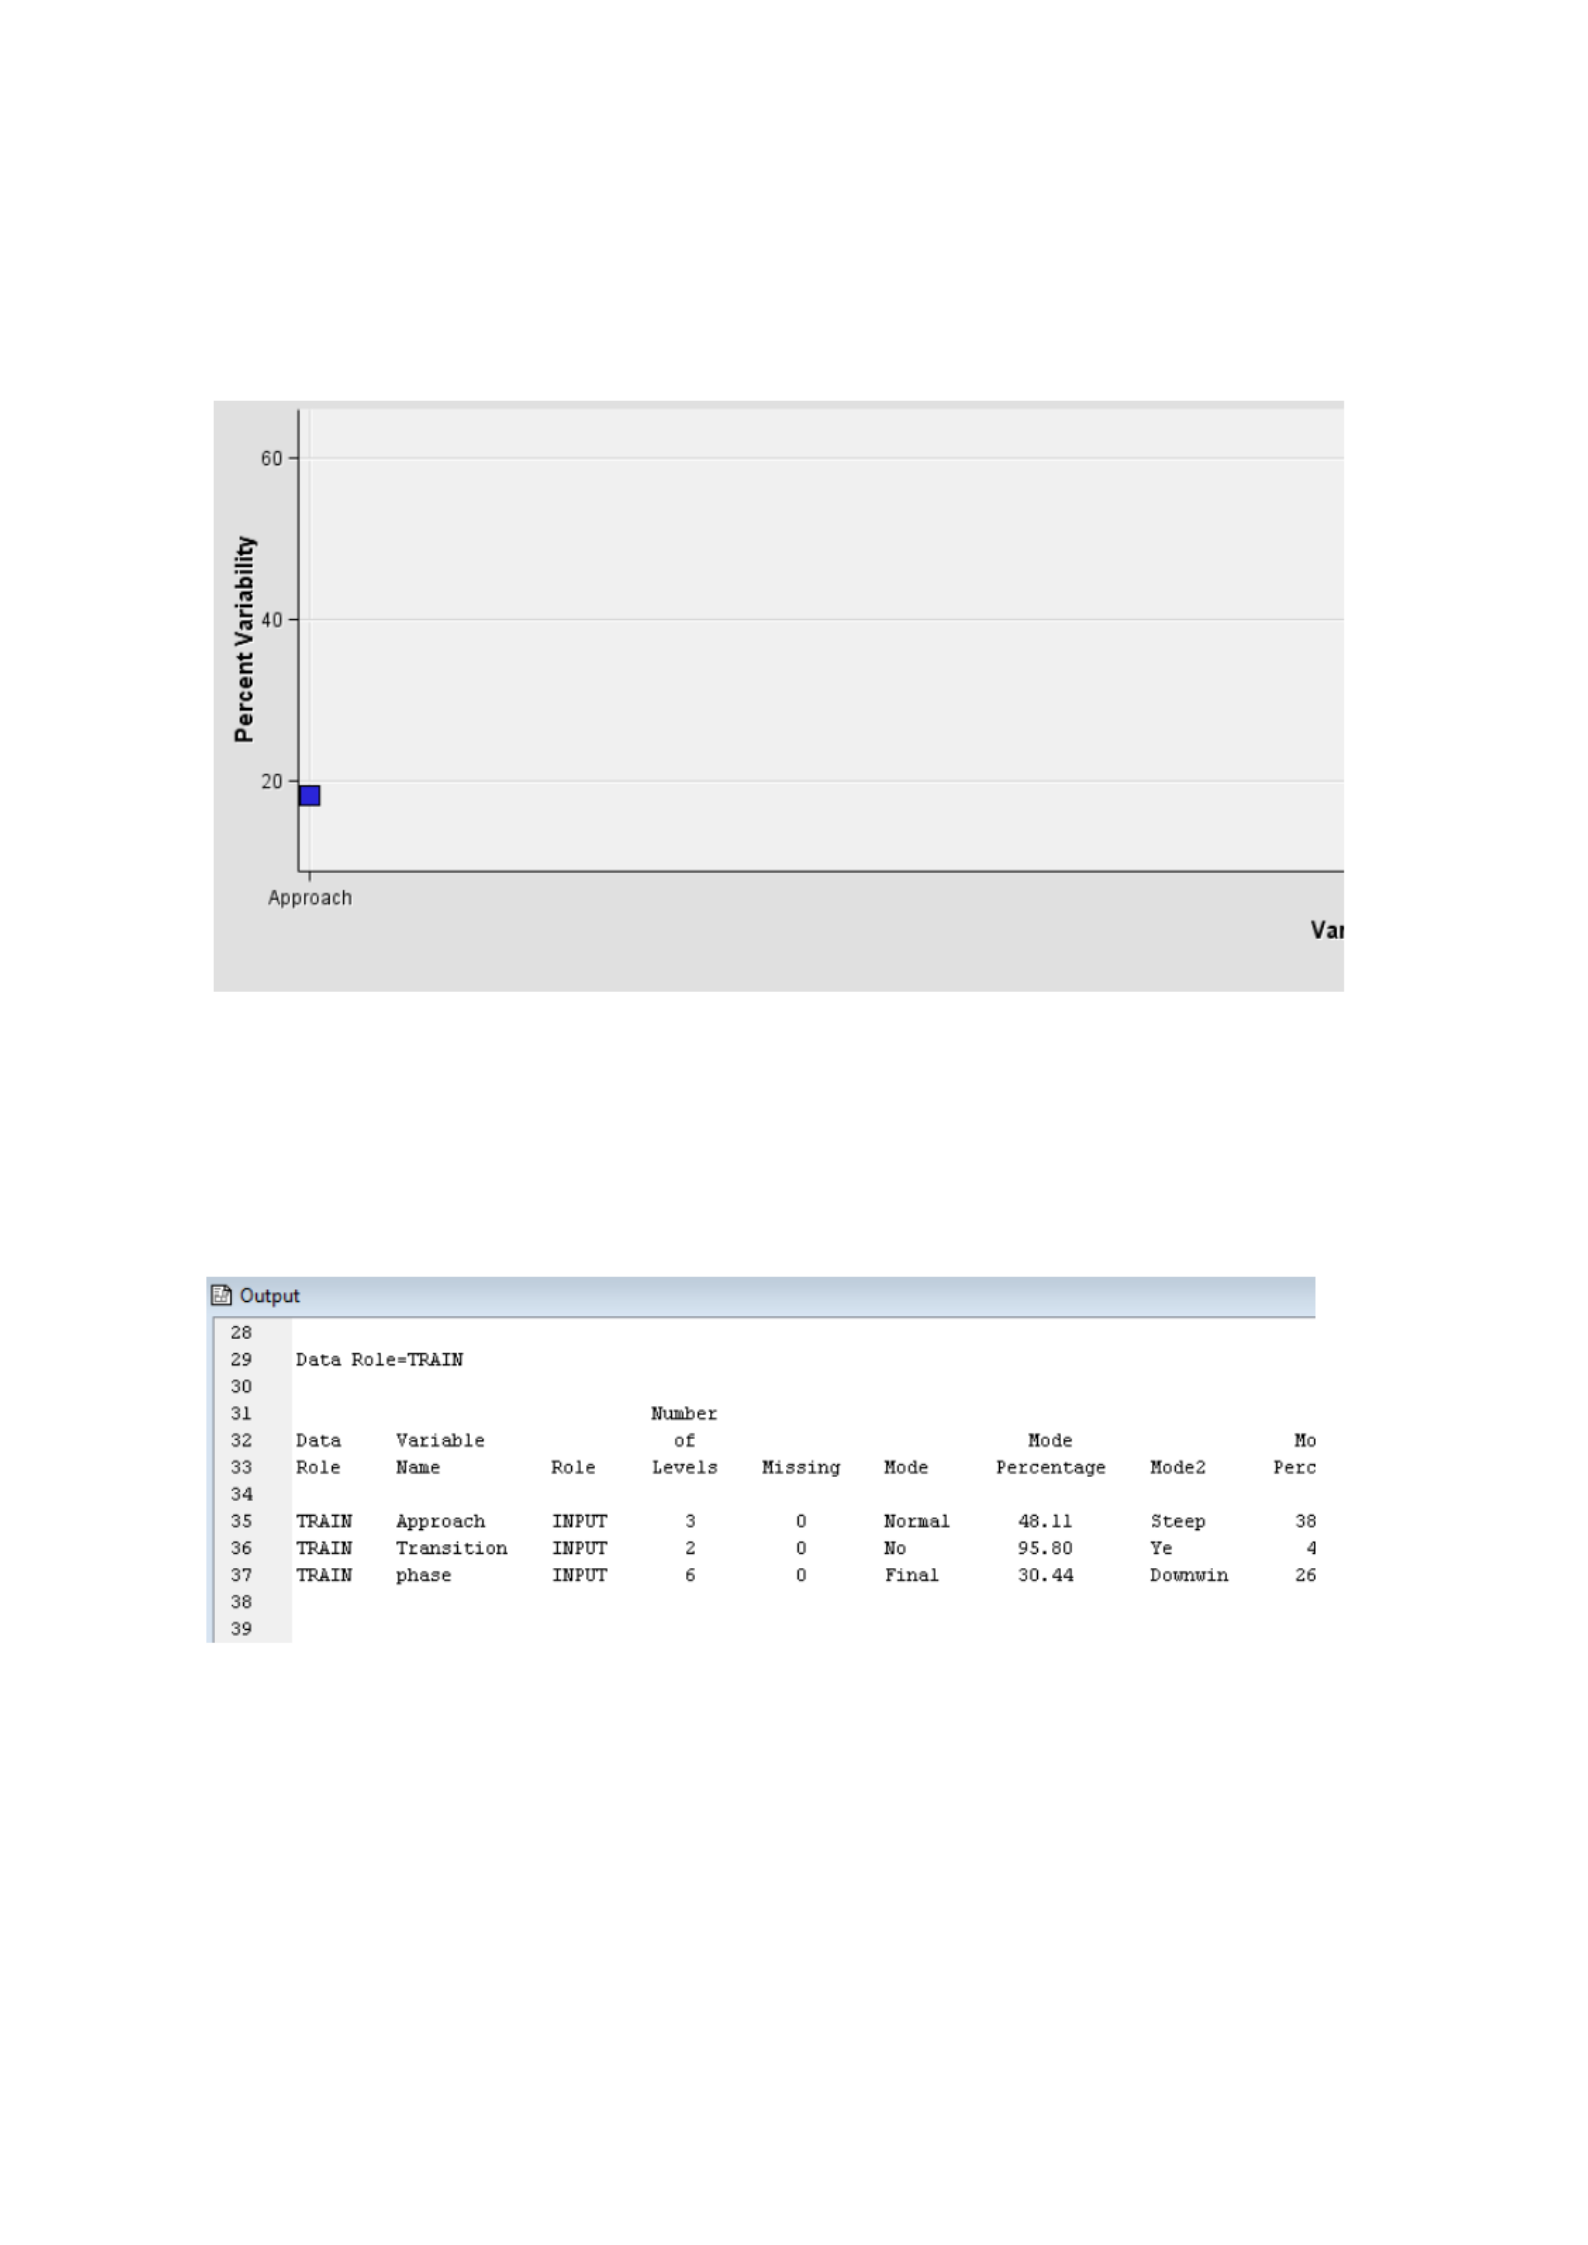
Figure
. e Data diagram to describe insight of the class variation e
according to percent variability and variable name of train data (e.g.,
approach, transition, and phase) using SAS Enterprise Miner.
Figure 8
. Data output to describe insight of the class variation
according to percent variability and variable name of train data (e.g.,
approach, transition, and phase) using SAS Enterprise Miner.
The figures above describe the insight using the
StatExplore
function in SAS Enterprise Miner. e From the insight investigation,
the mode and mode percentages consider at least two modes to
address the functional (target) class with comparison. The class

variation also includes the percent variability and the variable name
of each train data role according to the following variable names: a)
approach (first mode percentage is normal at 48.11%; second mode
percentage is steep at 38.81%) ; b) transition (first mode percentage
is no at 95.80%; second mode percentage is yes at 4.20%); and c)
phase (first mode percentage is final at 30.44%; second mode
percentage is downwind at 26.18%). This is vital to the ability to
explore additional visualization concepts with association to
approach, transition, and phase. A factor of (
No =
In the flight
phase) determined and basic statistics generated a calculation of
8031 subjects of the ID per a timestamp per milliseconds. As such,
a factor of (Yes = the transitional phase) determined and basic
statistics generated a calculation of 3546 subject of the ID per a
timestamp per milliseconds (see figure 9 below).
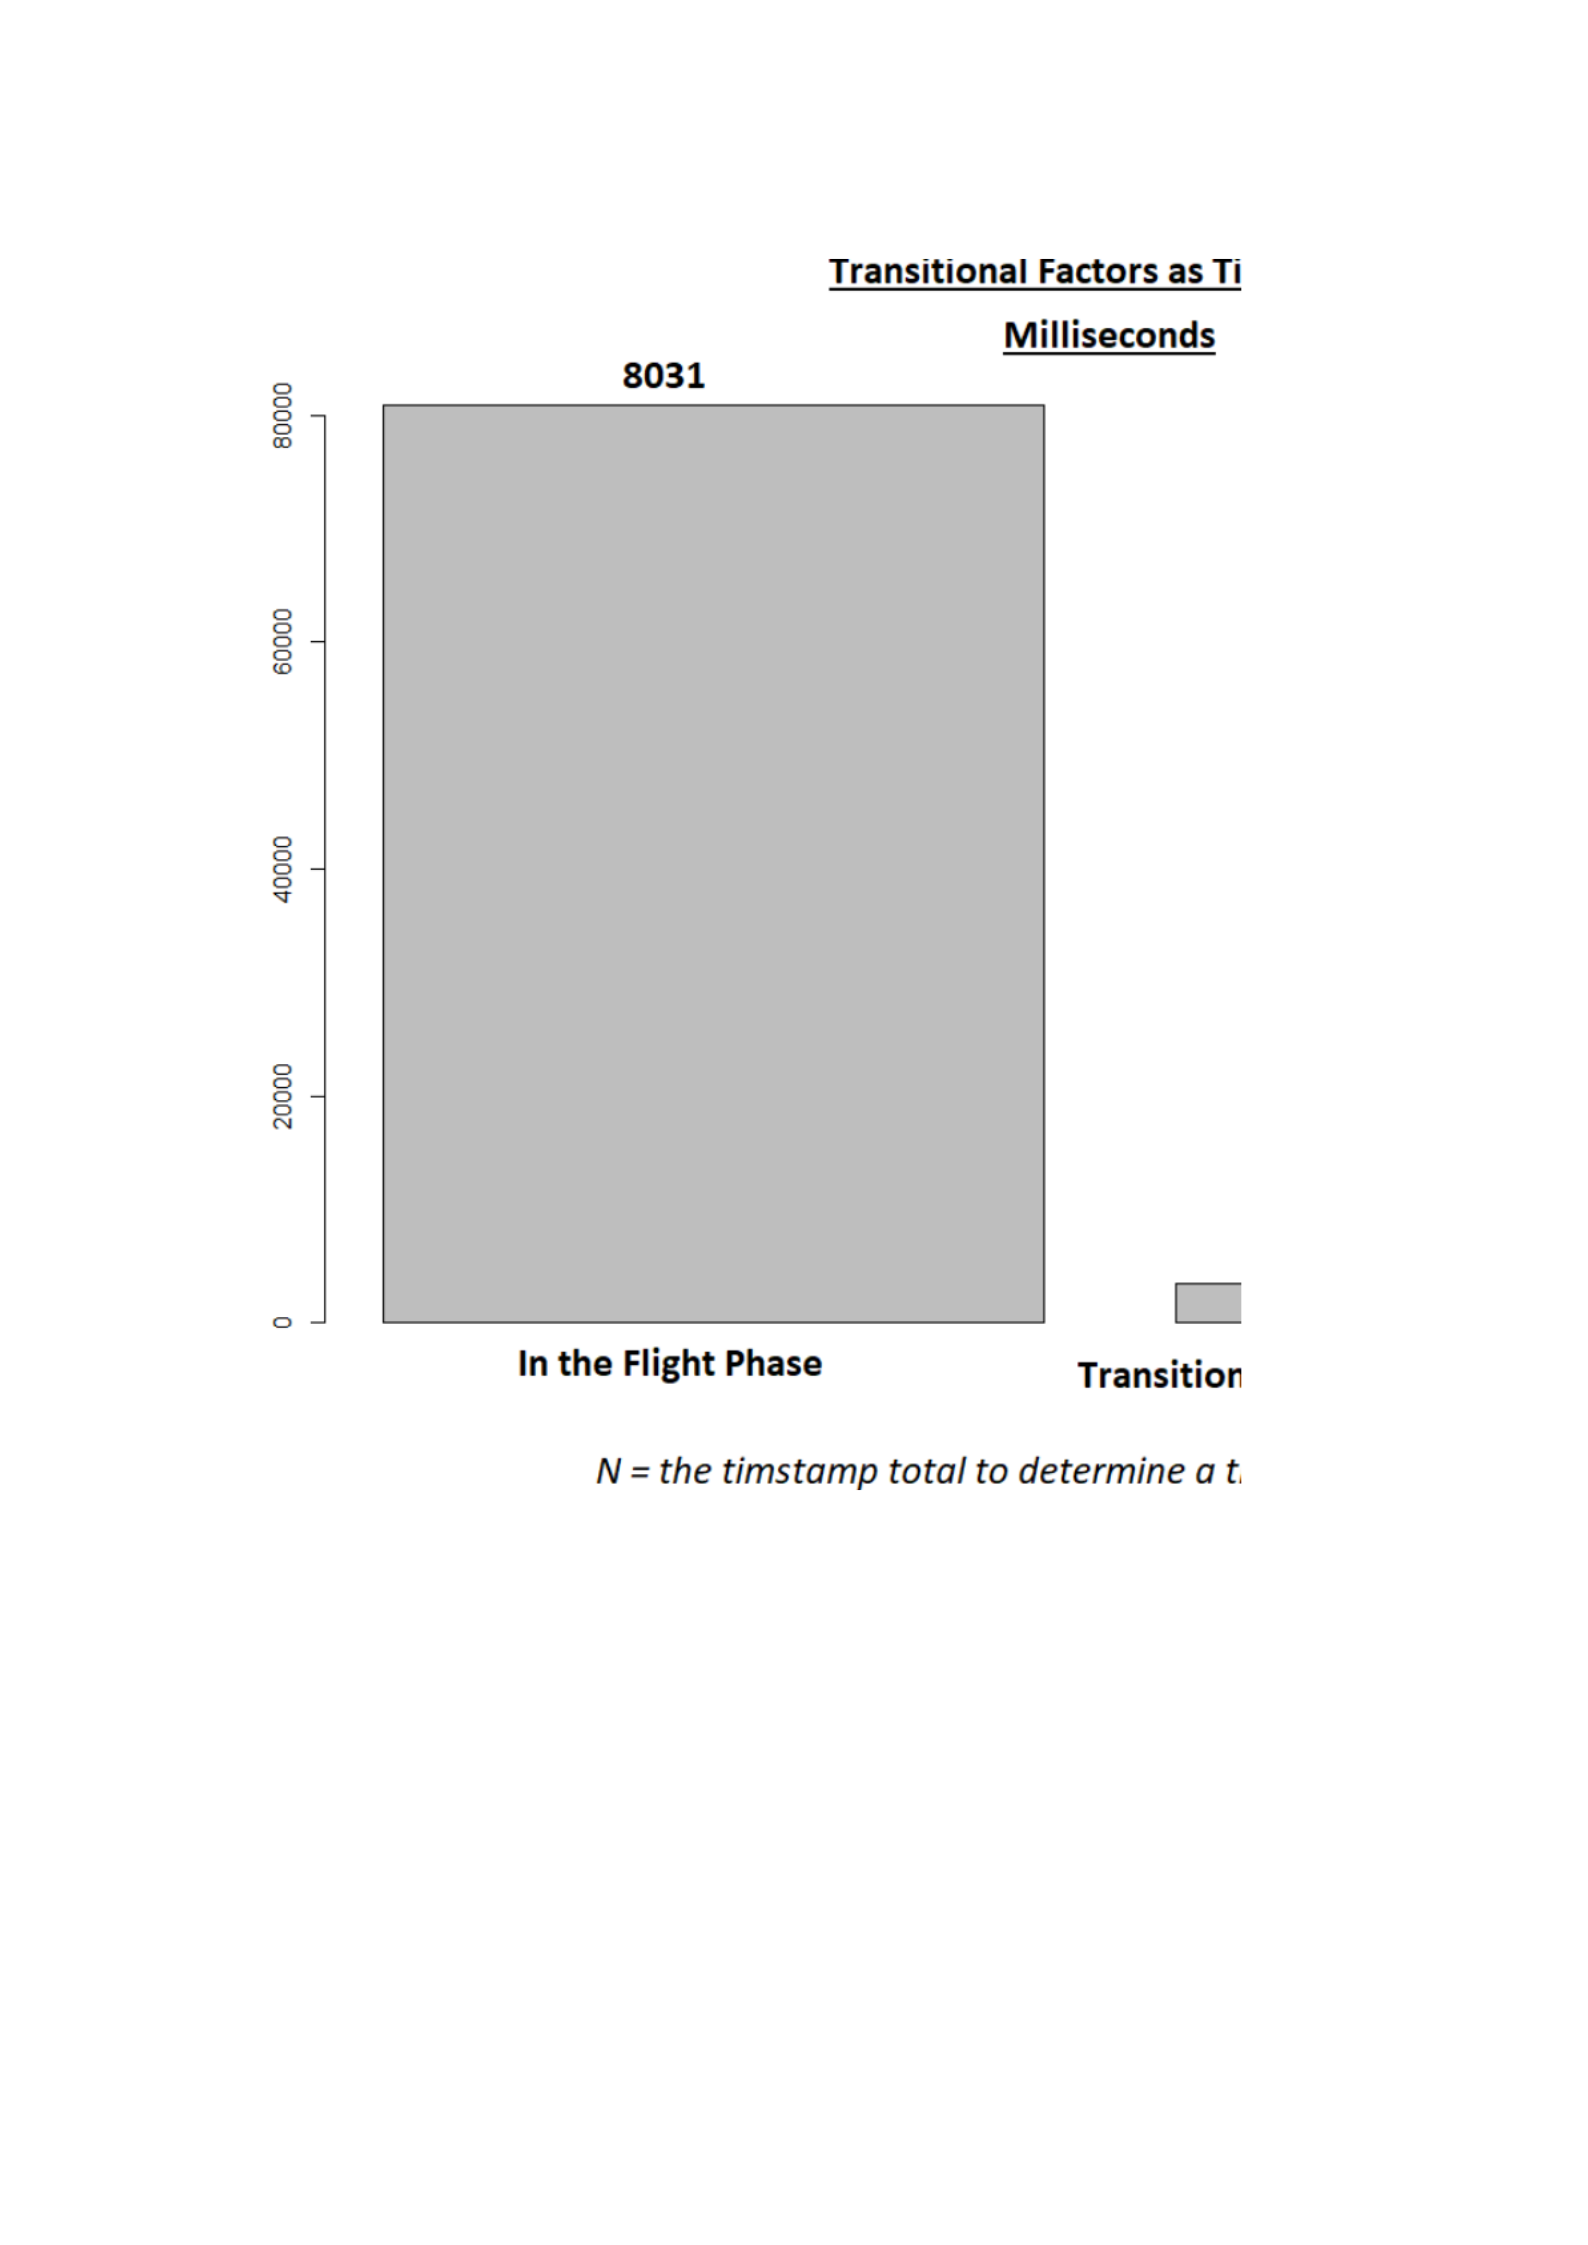
e e e e
Figure
. e Described
Transition Segment
(N= 2 mins per phase
segment) with a total score of 4 minutes as ID in R Programming
Language.
The traffic pattern of an in the flight phase and the transitional
phase segment can be classified as a binary function. e The aim of
this study is too easy distribute the performed factors to be
associated with the application phase of each classified parameter.
The factors included the term
transition
and the examination to
ensure the usefulness of the application collected study data to
monitor flight performances. This common baseline as a
characteristic had accomplished the task to export the data source
to understanding the user interaction according to the flight
performance environments in a traffic pattern. The
No
factor is
presented as
in the flight phase
(e.g., takeoff, crosswind, downwind,
base, final, and touchdown). In comparison the
Yes,
this includes
the
transitional phase
(i.e., per a 2 minute per phase segment to
total 4 minutes, which this study accounts for a transition as
described in the figures below
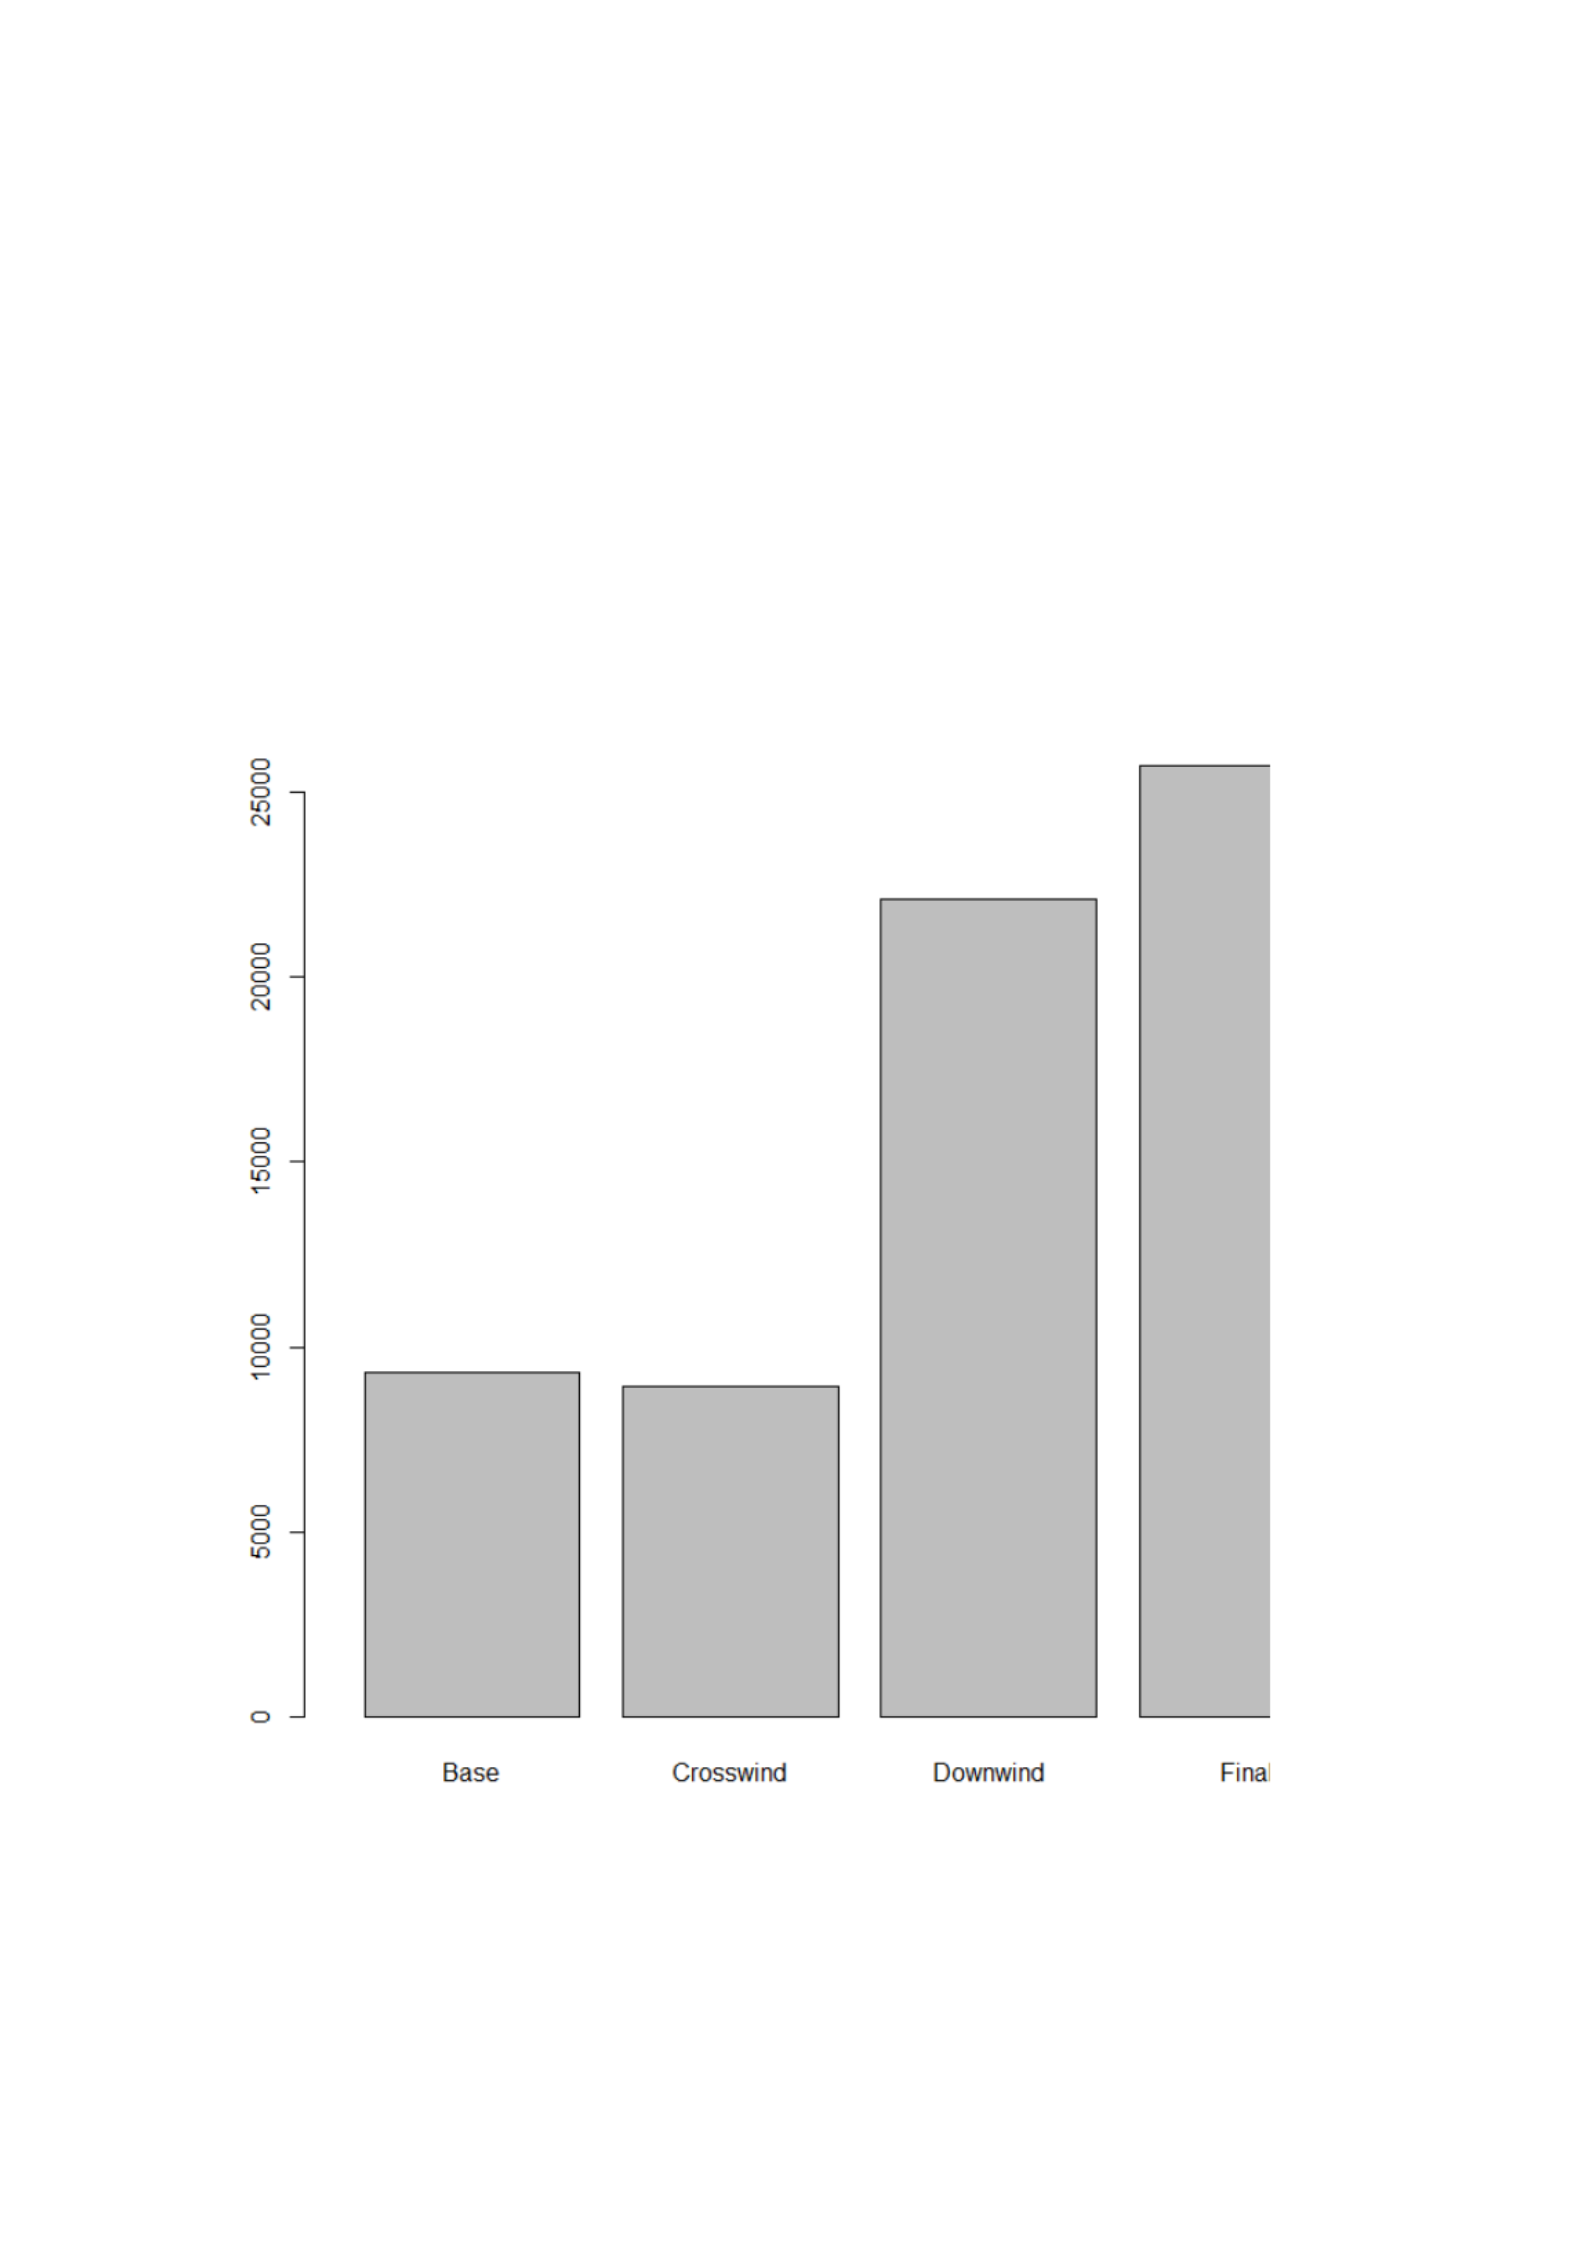
Figure
. e Described
Phase
of a Traffic Pattern associated with the
timestamp to preformed as ID in R Programming Language.
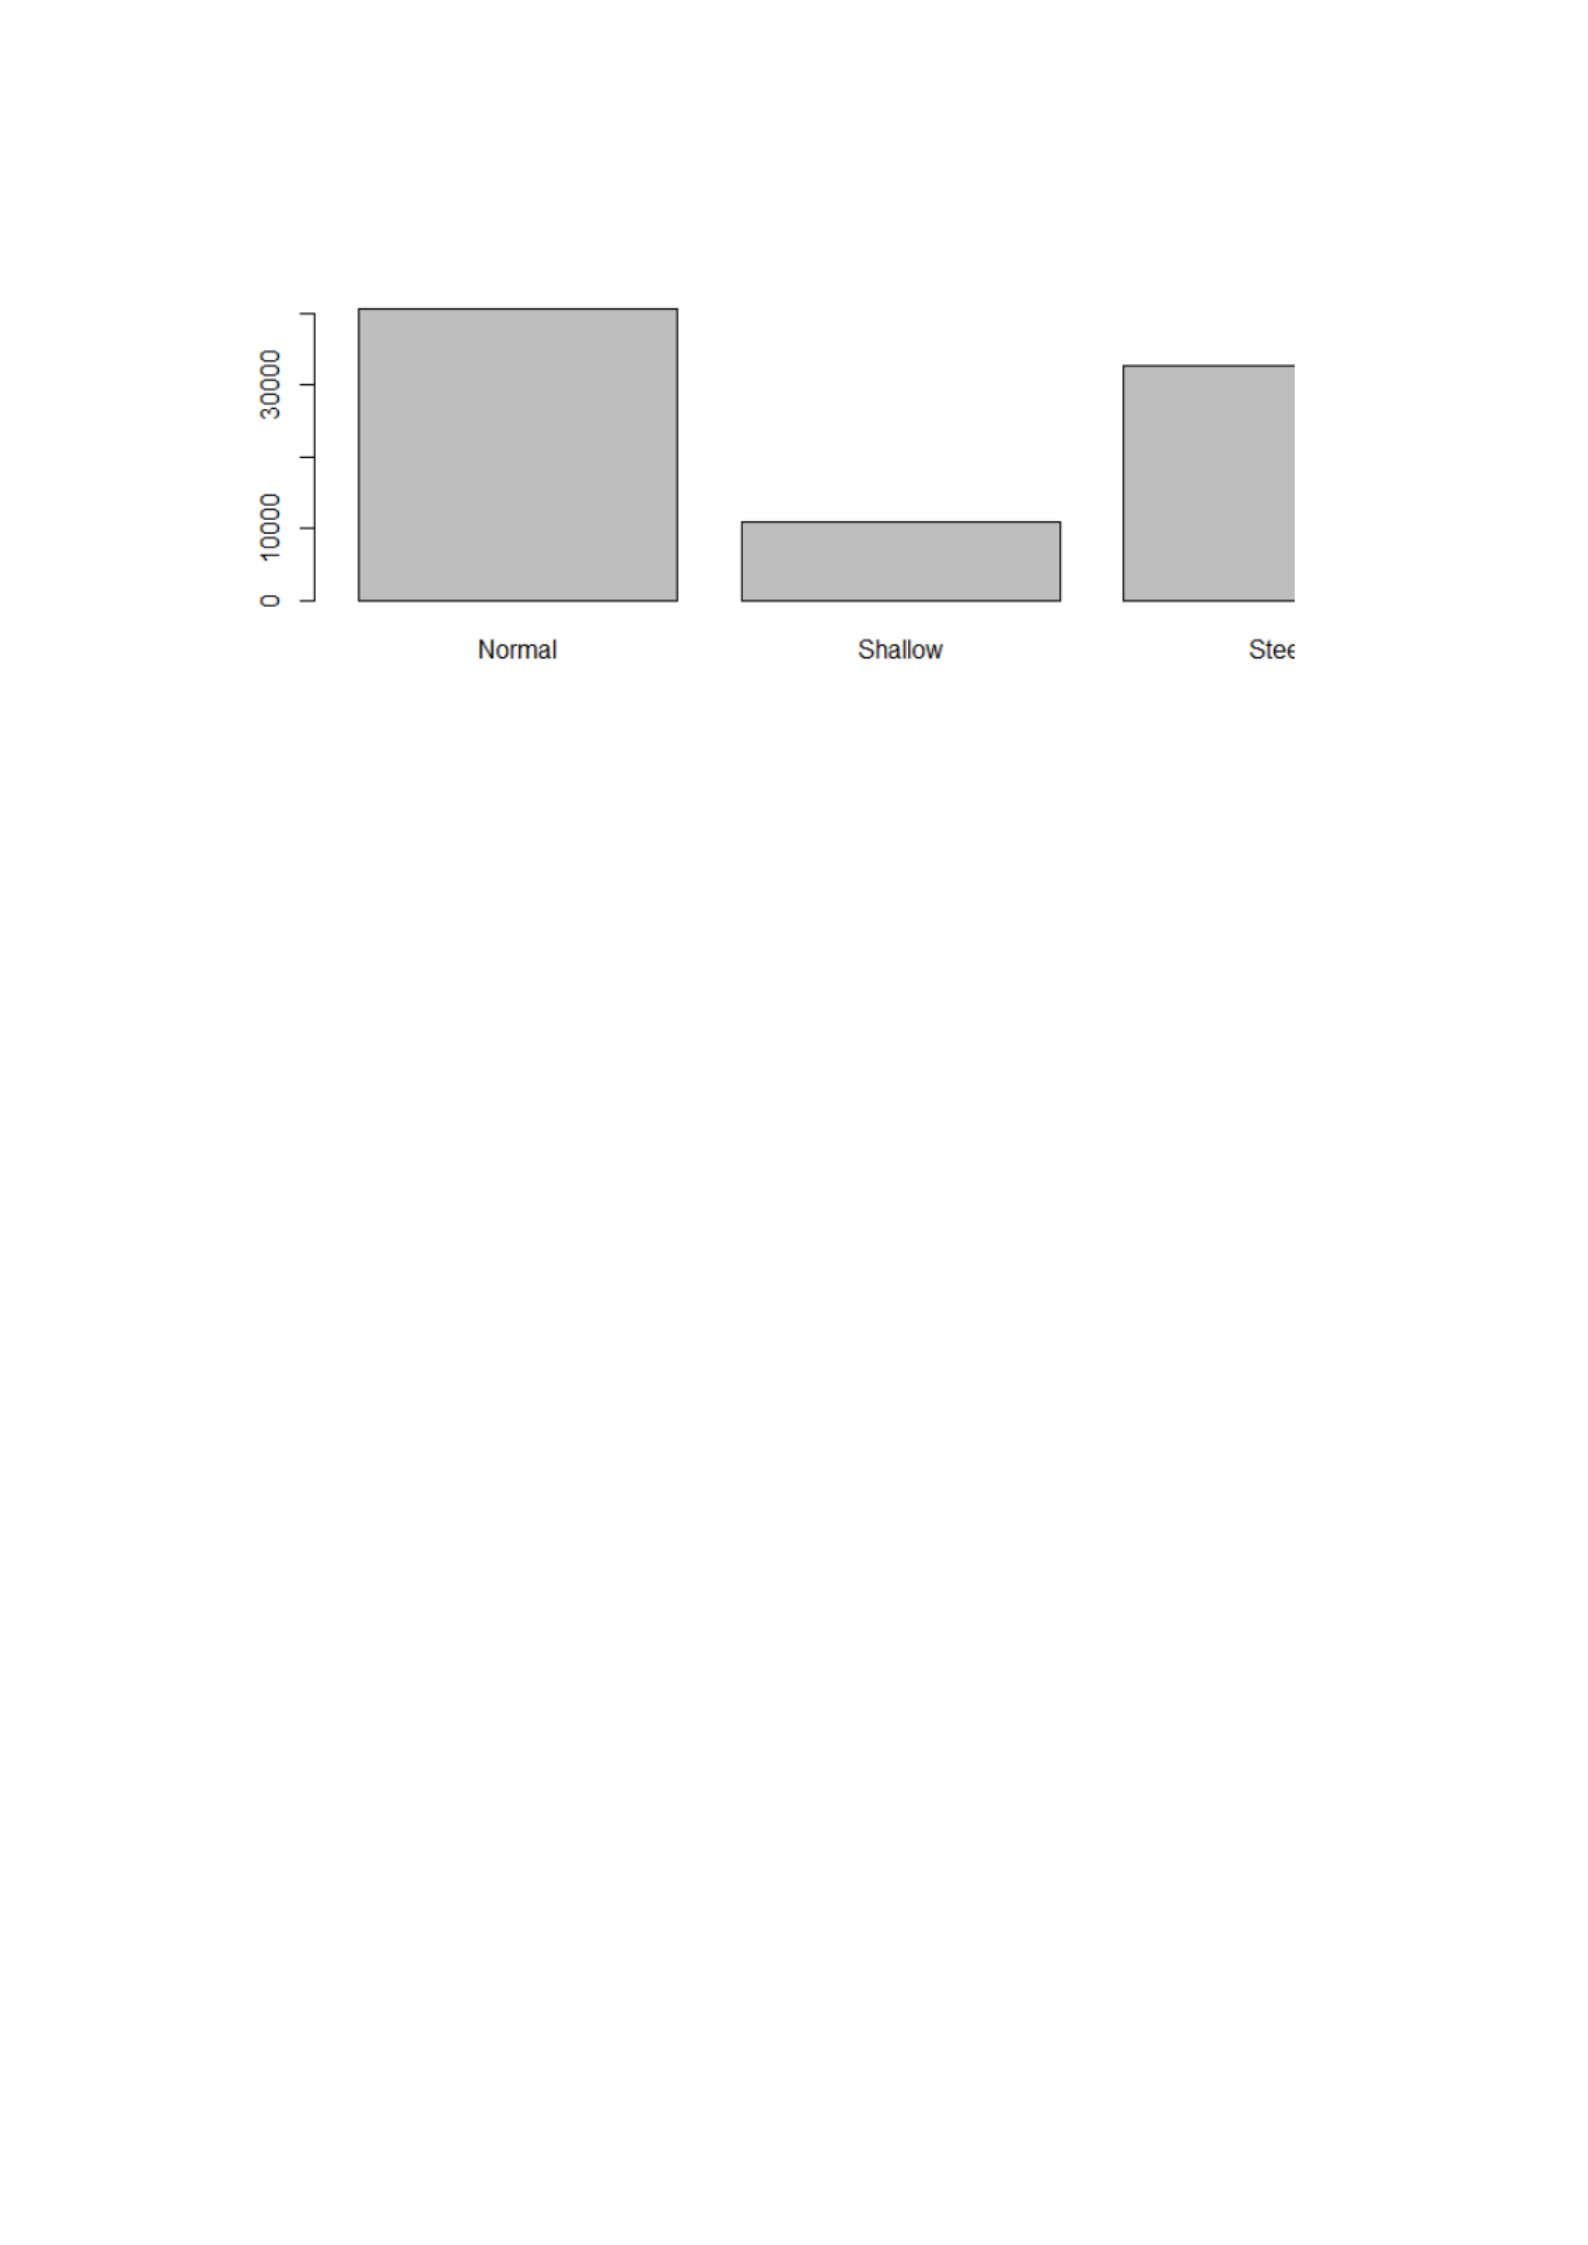
Figure
. e Described
Approach
of a Traffic Pattern associated with the
timestamp to preformed as ID in R Programming Language.
Based on the train variable names, the data measures with respect
to the underlying distribution of each input values introduce
methods for characterization and comparability. e These properties
are proposed as a statistical method to visualize and interpret the
graphical inference tools according to the baseline characteristics.
The added input can be export from the used data capture system
of the function label
transition
that includes the implementation of a
factor analysis individually for each data input. The function
transition
has been defined as the transitional factors regarding the
phases of flight (in a traffic pattern) according to performance and
functionality. The action to further investigate the described
insights include the exploration of a plot matrix and the class
association (e.g., no and yes of the transitional traffic phase
segment) to each variable input. e The figures below are the
visualization using Weka Explorer according to the transition and
the selected instance of the data representation (i.e., approach,
transition, and phase) (see figures below) .
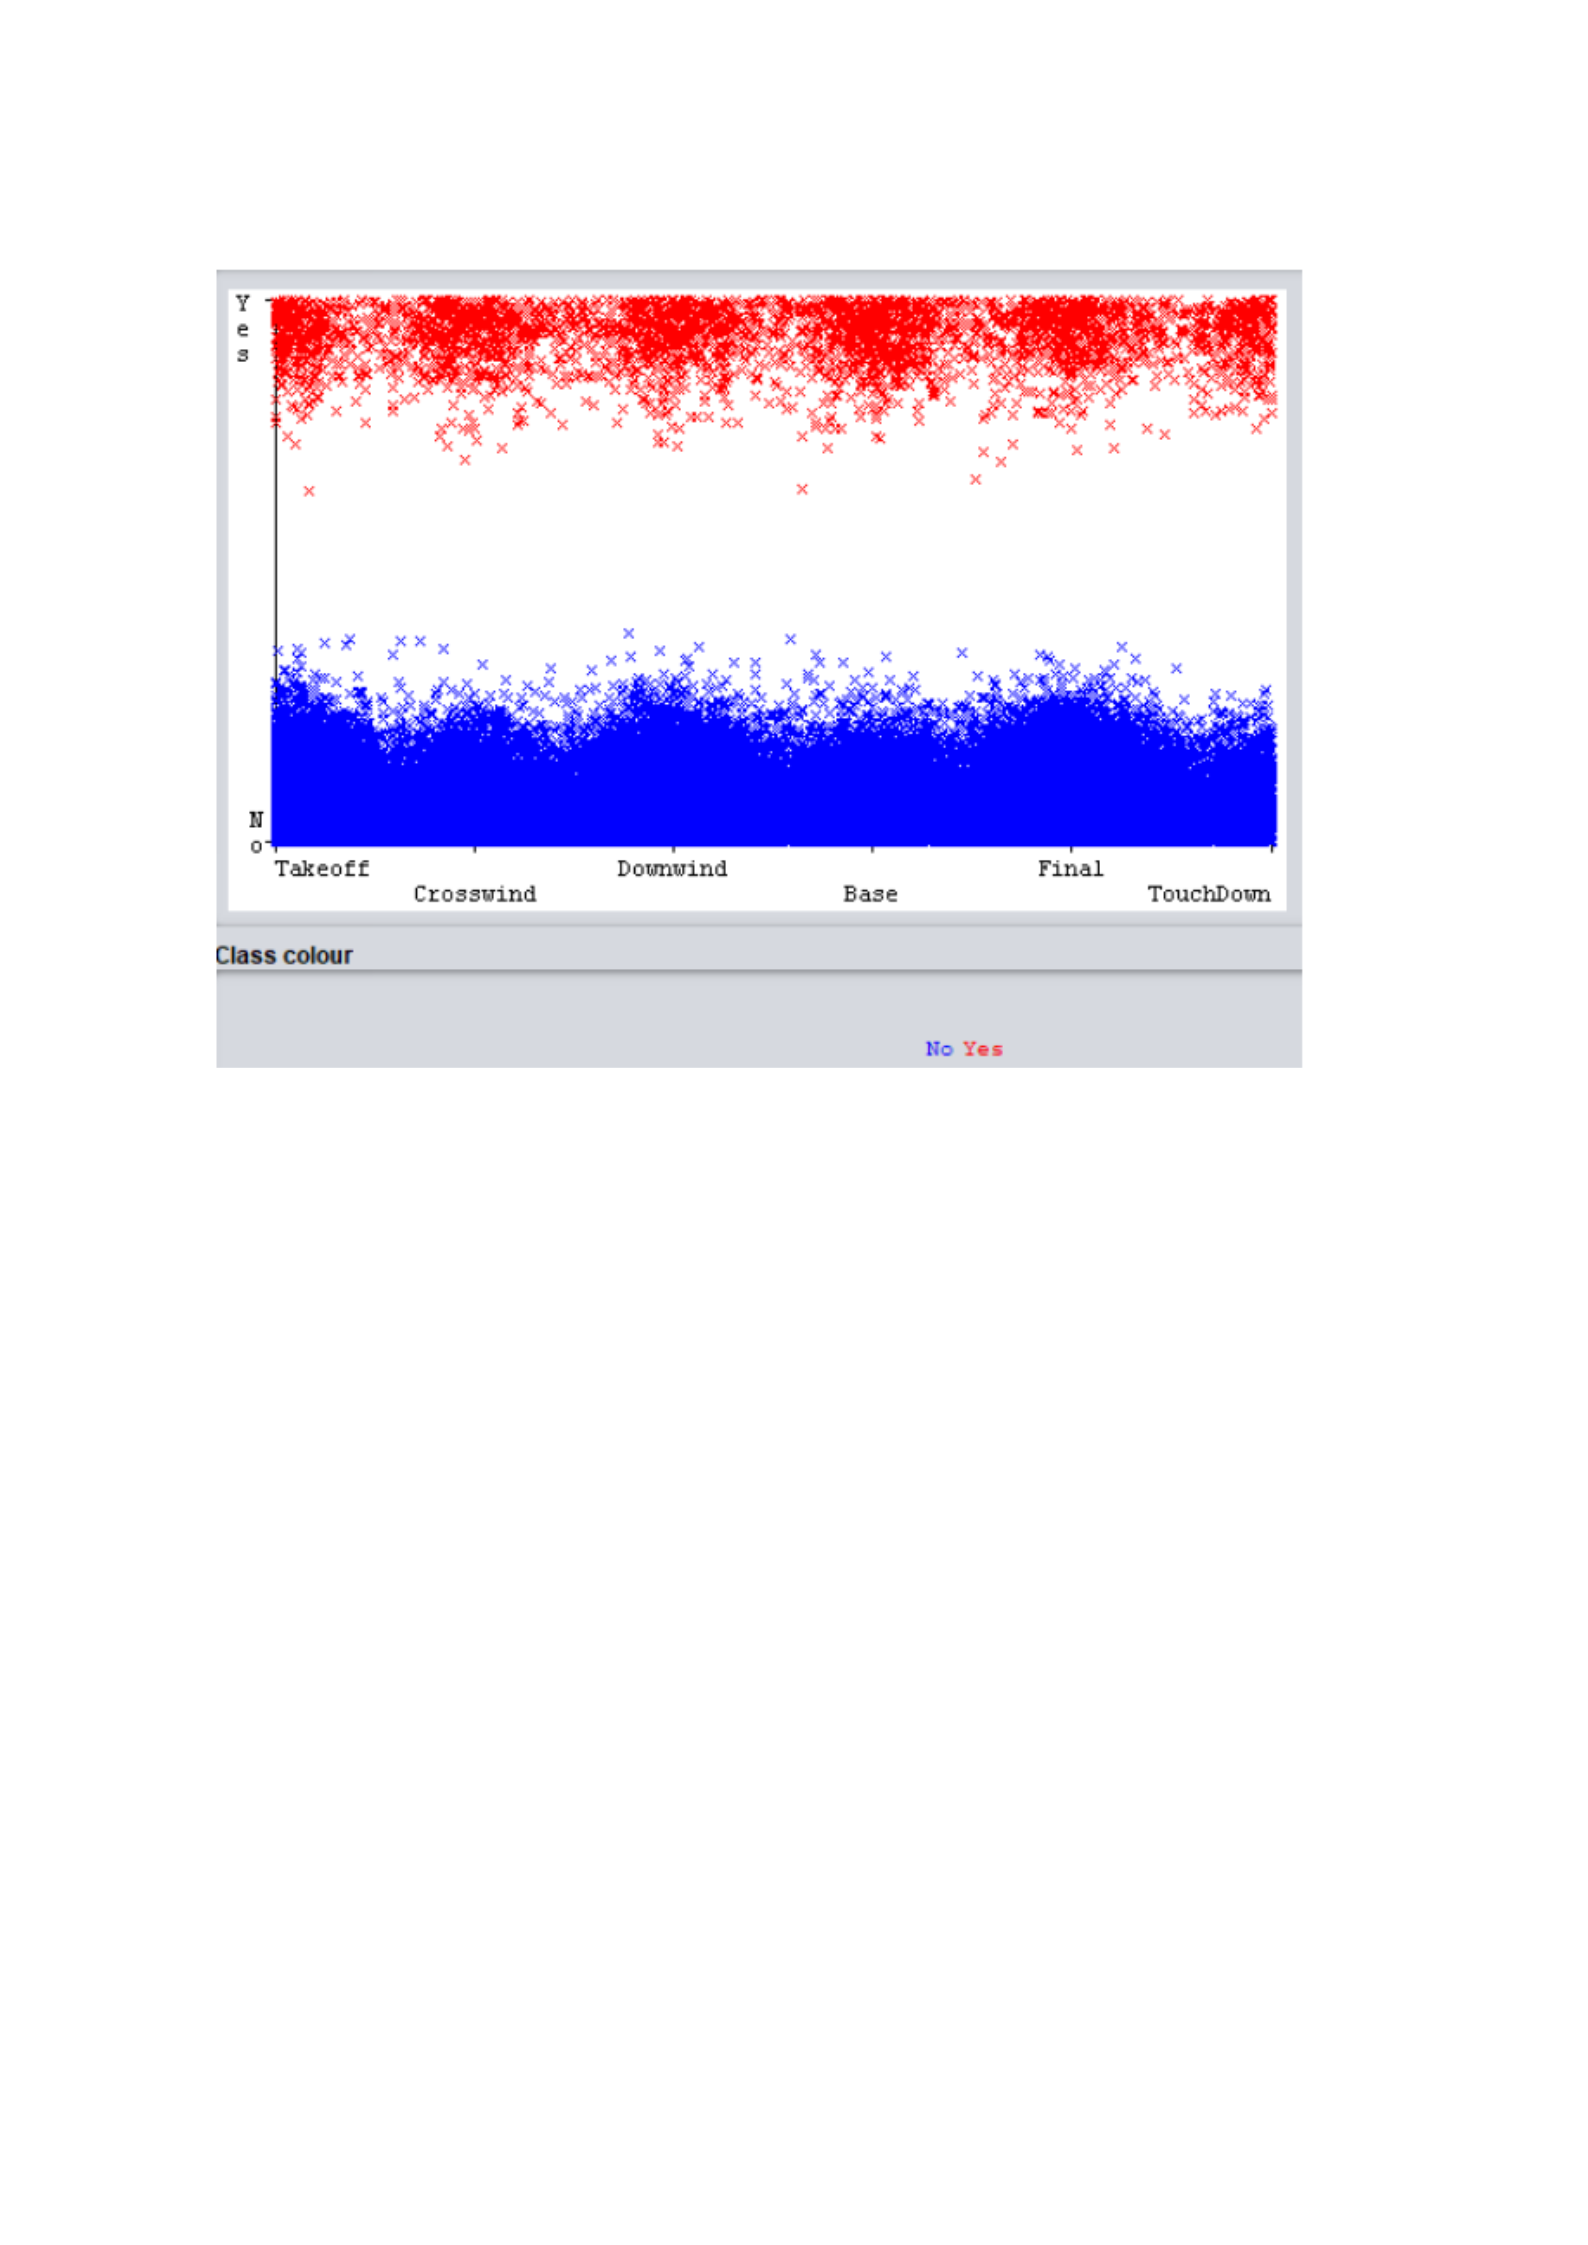
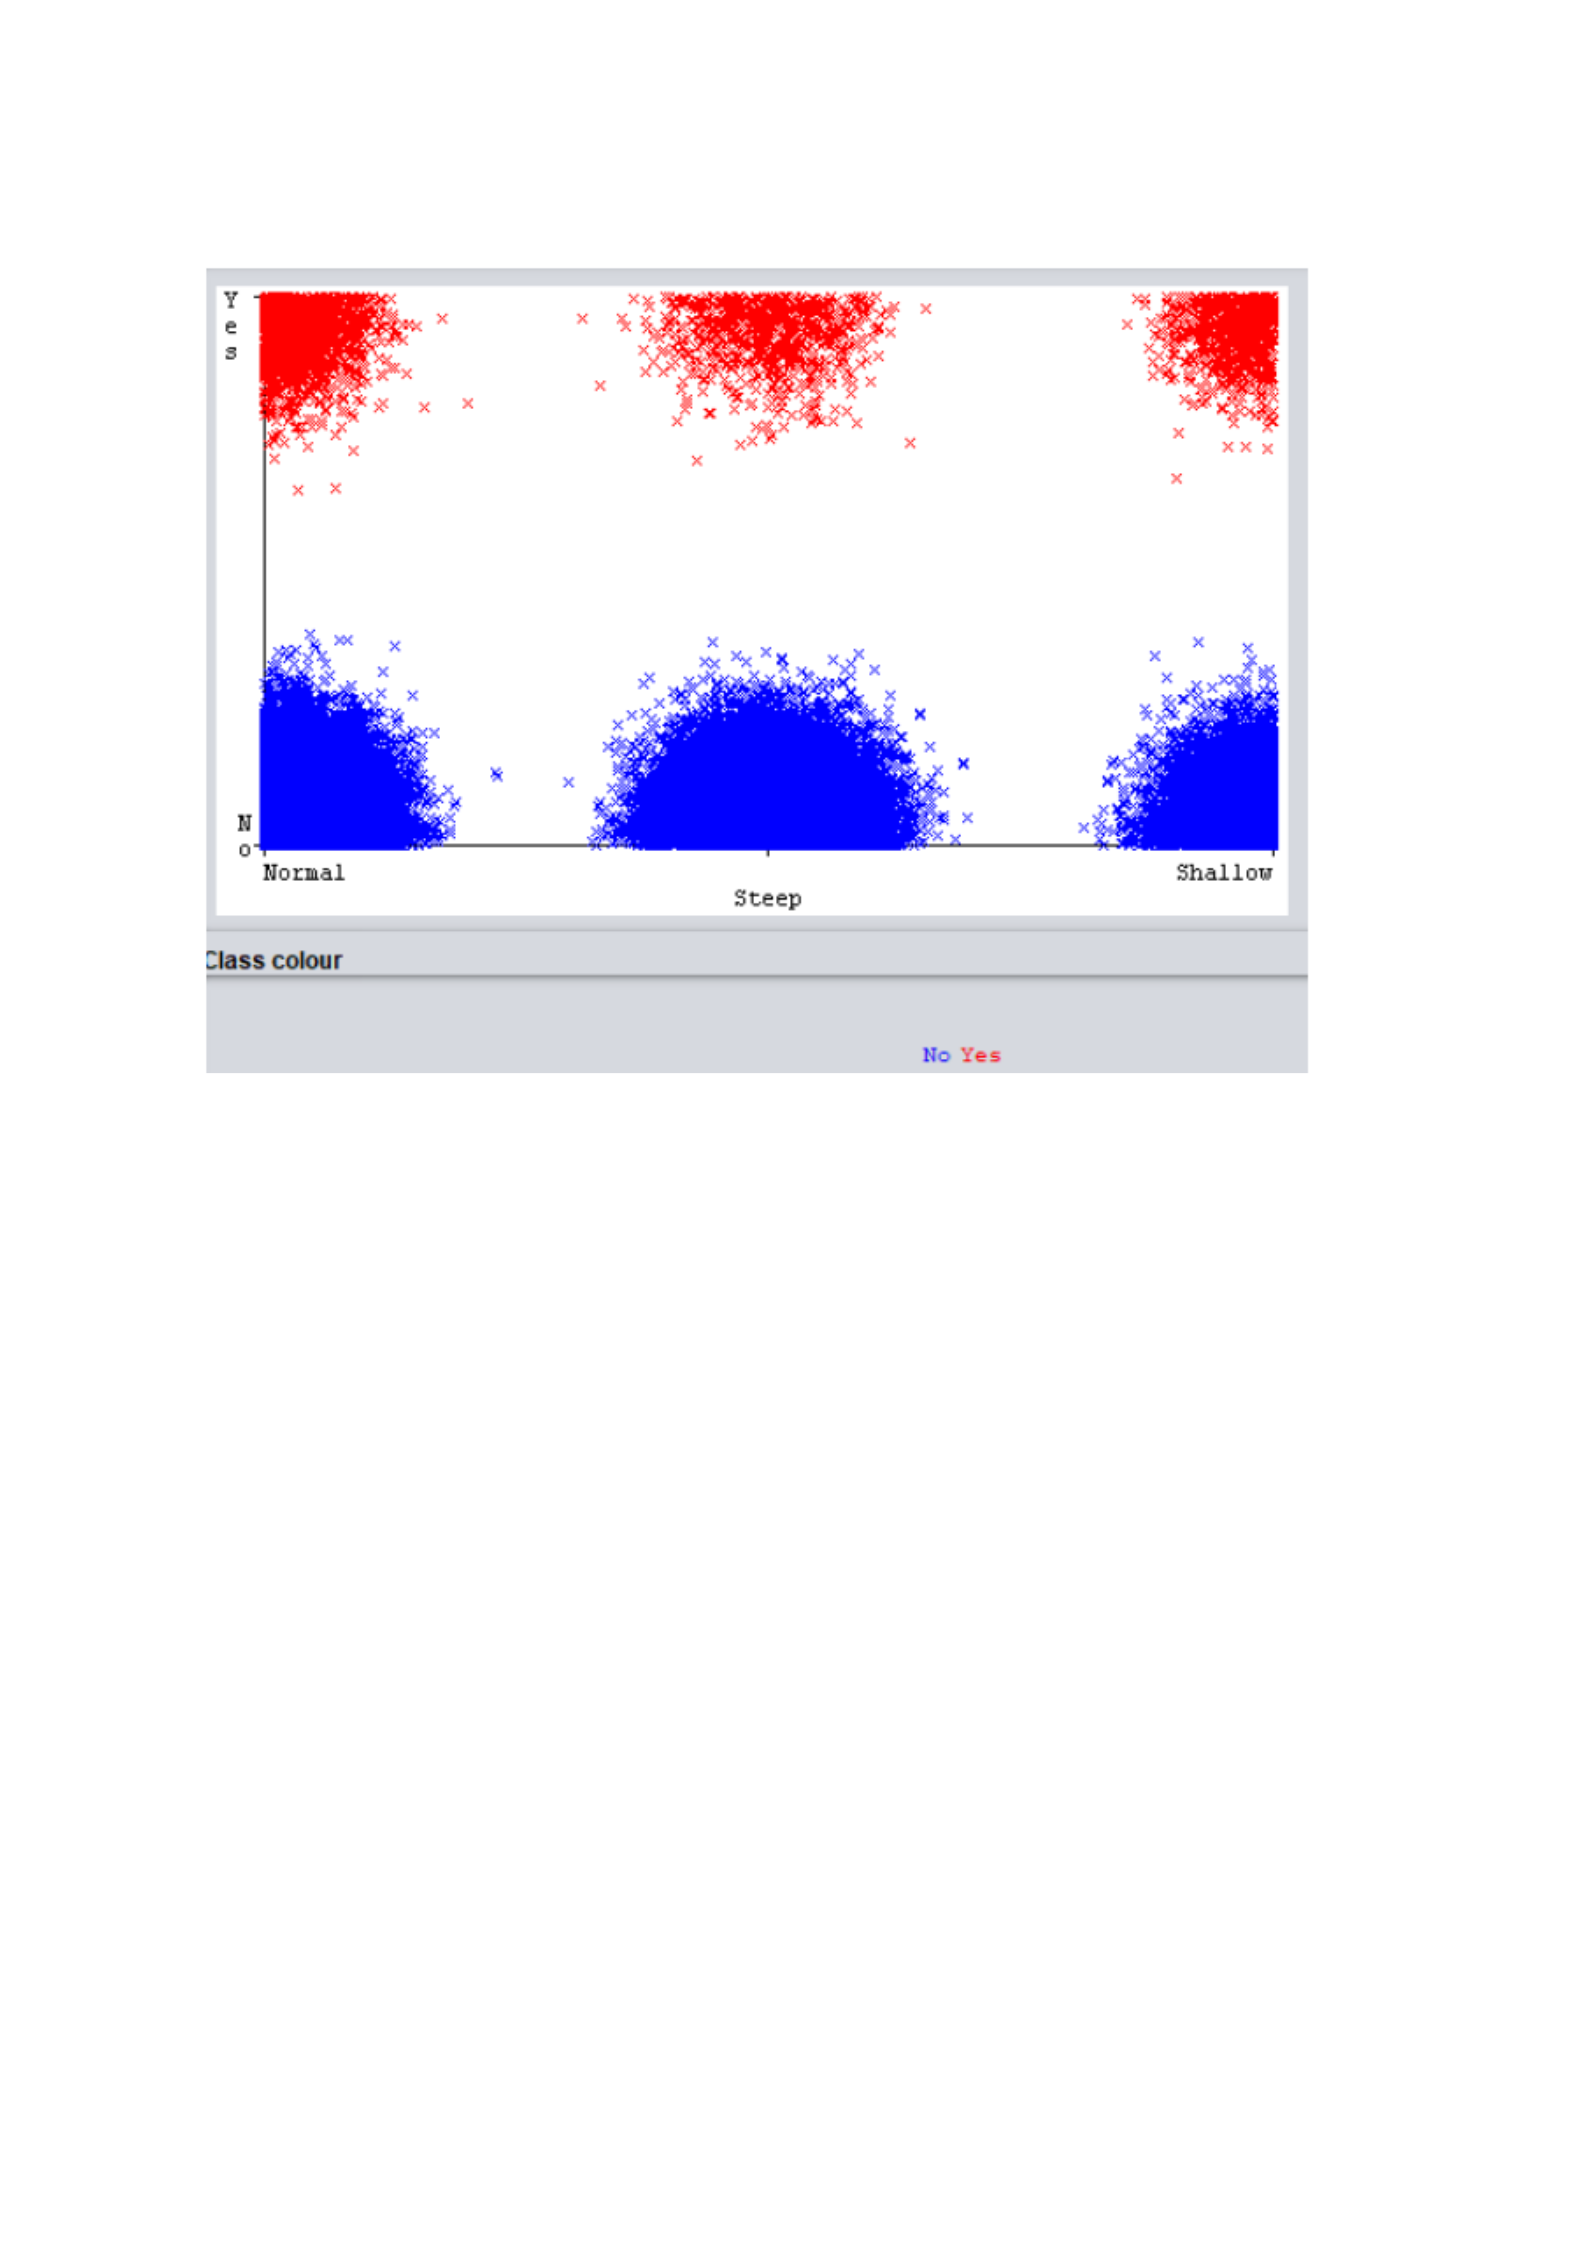
Figure
. e Phase (variable name) described insight using a plot matrix
visualization according to the Phase (x: variable name) and
Transition (y: factor) with the class color (e.g., no and yes) in Weka
Explorer.
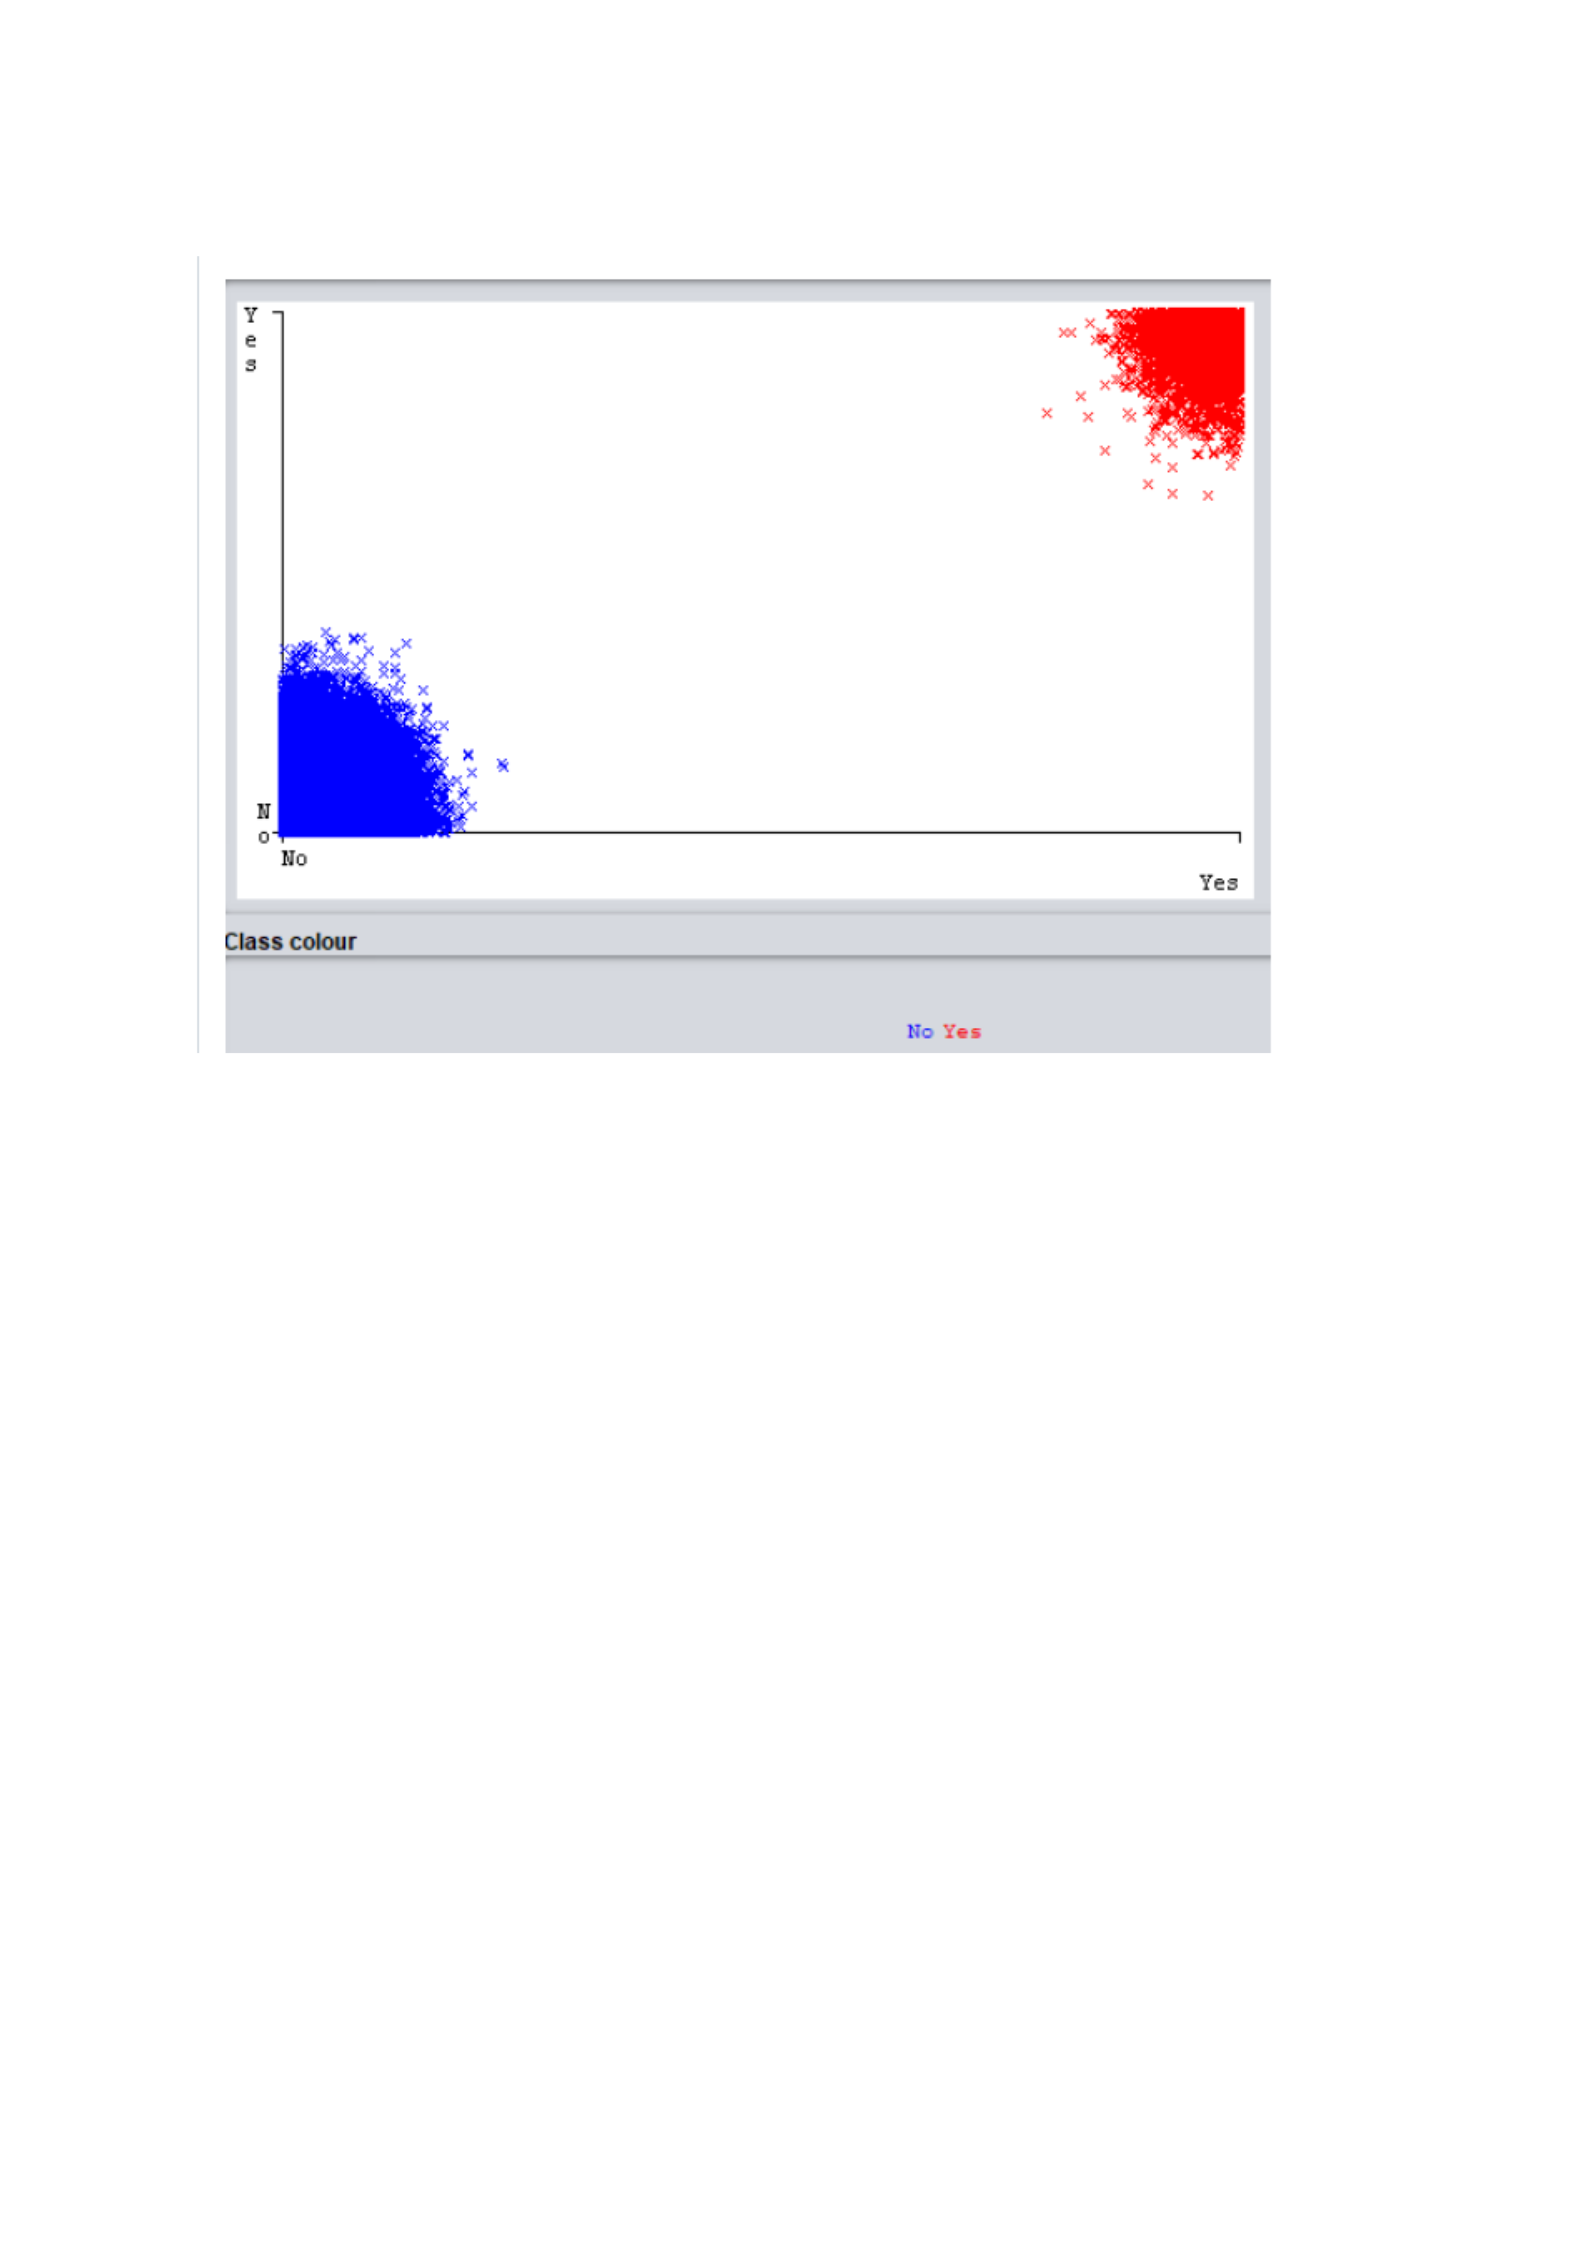
Figure
. e Approach (variable name) described insight using a plot
matrix visualization according to the Approach (x: variable name)
and Transition (y: factor) with the class color (e.g., no and yes) in
Weka Explorer.
Figure
. e Transition segment (variable name) described insight using a
plot matrix visualization according to the Transition (x: variable
name) and Transition (y: factor) with the class color (e.g., no and yes)
in Weka Explorer.
This discovery had altered the scope to focus the data analysis
according to three elements (e.g., approach, transition, and phase) to
understanding the transition segment of a traffic pattern. e The
correlation among the traffic pattern transition segment considers
the dynamics expressed in short-term of dependences and the
target variables. These proposed target variables can be explored to
predict mutual information and the performance selected of
predicted results. The results provided can show the proposed
methods to achieve the necessary action as expressed of each
transition segment significant to the traffic pattern in flight
operation near airports. From the evaluation, the three elements
allowed for the ability to address the characteristic behavioral
patterns and the scalability of the dataset contains The Naïve Bayes
classifier was consider understanding the pattern mining techniques
according to the criteria evaluation on training set (see table below).

Table
. e Evaluation on training setoff the Summary with Detailed
Accuracy by Class using a Confusion Matrix in Weka Explorer.
e e e e The features are detailed with accuracy by class as this
discovery allowed for the confusion matrix to be classified as
no and
yes
. e The research work will include the proposed weighted average
as the selection algorithm to balance the various condition for
predictive modeling. This proposed technique can improve the
overall performance in terms of accuracy for model development
and evaluation of the training set. In comparison, the unweighted
versus weighted model is significant to capture the effects to create
a fair and balanced classification. Without consideration, this
altered condition can lead to an unbalanced cluster of classified
instances. Therefore, the benefit allows for a heuristic
consideration to analyze behaviors of the target class using the
statistical features with a level of accuracy proposed. This will
effective in understanding the attributes and how the future
evaluation on training set can be influenced (see figure below of all
the attributes plots).
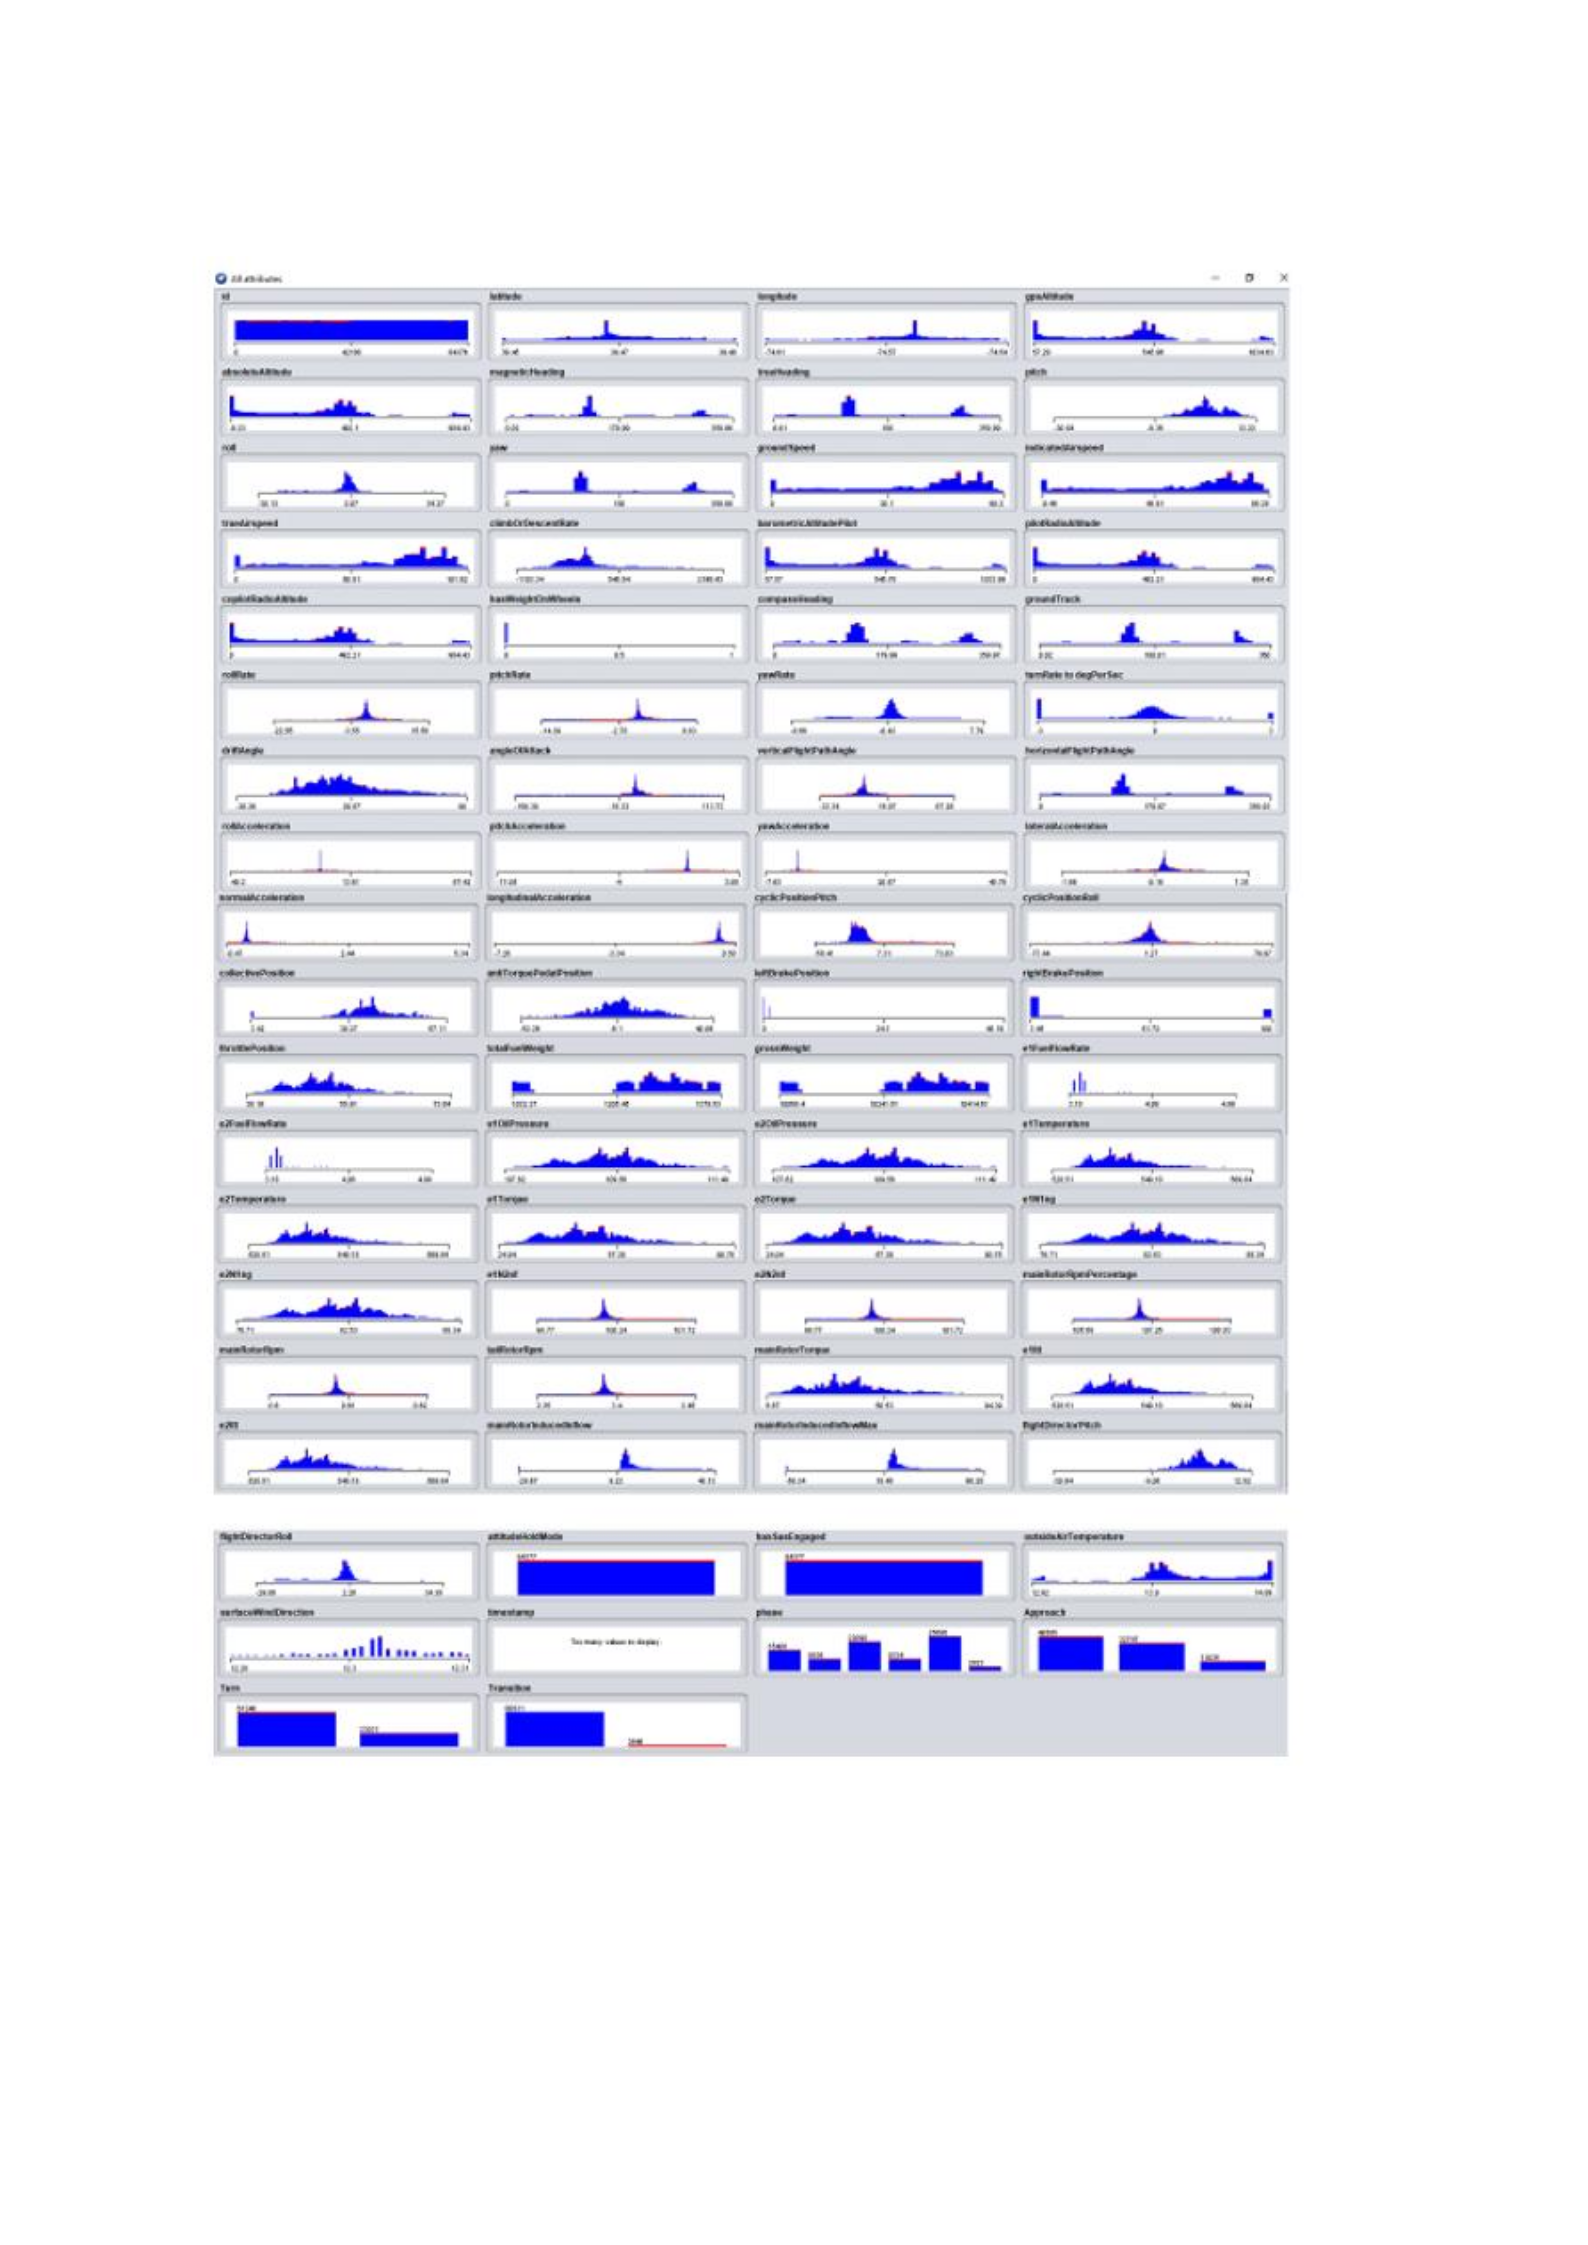
Figure
. e All the attributes plot for evaluation in Weka Explorer.

